i) The diameter of the coils making the springs are different
ii) The wires making the springs have different thickness
iii) The number of turns per unit length is different
iv) The length of springs is different
johnmulu answered the question on April 19, 2017 at 09:16
-
The spiral spring shown in Figure 4 are identical. Each spring has a spring constant k = 300 N/m
(Solved)
The spiral spring shown in Figure 4 are identical. Each spring has a spring constant k = 300 N/m
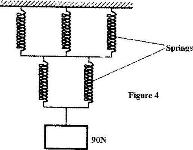
Determine the total extension caused by the 90 N weight. (Ignore the weight of the springs and connecting rods)
Date posted:
April 19, 2017
.
Answers (1)
-
Two identical spring balances R and S each weighing 0.5 N are arranged as shown in Figure 2.
(Solved)
Two identical spring balances R and S each weighing 0.5 N are arranged as shown in Figure 2.
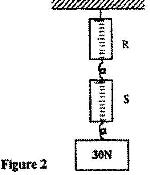
What is the reading on balance R?
Date posted:
April 19, 2017
.
Answers (1)
-
Figure 7 shows a simple electric bell circuit
(Solved)
Figure 7 shows a simple electric bell circuit
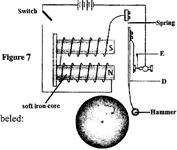
i) Name the parts labeled:
I) D
II) E
ii) When the switch is closed, the hammer hits the gong repeatedly. Explain why?
I) The hammer hits the gong.
II) The hammer hits the gong repeatedly
Date posted:
April 19, 2017
.
Answers (1)
-
Figure 7 shows two similar coils P and Q around the end L and M of a piece of soft iron. A steady current passes through the coils
(Solved)
Figure 7 shows two similar coils P and Q around the end L and M of a piece of soft iron. A steady current passes through the coils
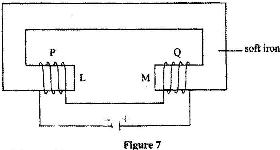
State the polarity of the resulting magnet at point L
Date posted:
April 19, 2017
.
Answers (1)
-
Figure 5, shows a motor connected to a magnetic switch called a relay operated by an ordinary switch S1. Use the information in the figure to answer questions a) and b)
(Solved)
Figure 5, shows a motor connected to a magnetic switch called a relay operated by an ordinary switch S1. Use the information in the figure to answer questions a) and b)
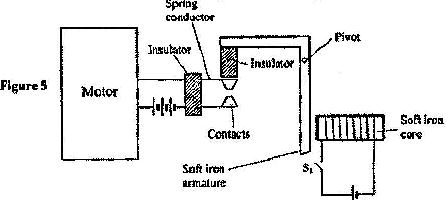
a) Explain how the relay switches on the motor when S1 is closed
b) State with a reason the effect on the motor, if the iron core is replaced with a steel core and switch S1 is put on and then off.
Date posted:
April 19, 2017
.
Answers (1)
-
Figure 3 shows a flat spring made of iron clamped horizontally on the bench over a solenoid.
(Solved)
Figure 3 shows a flat spring made of iron clamped horizontally on the bench over a solenoid.
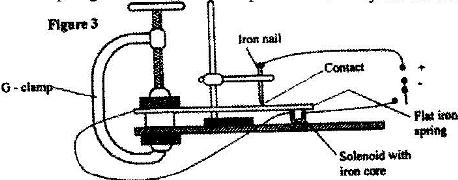
When the switch is closed, the spring vibrates. Explain this observation.
Date posted:
April 19, 2017
.
Answers (1)
-
Figure 8 shows a current-carrying coil in a magnetic field
(Solved)
Figure 8 shows a current-carrying coil in a magnetic field
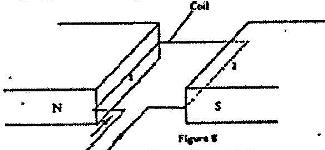
State two ways of increasing the force on the coil
Date posted:
April 19, 2017
.
Answers (1)
-
Figure 8 shows two parallel thick copper conductors connected to a d.c. power supply. A rider made from a thin copper wire is placed on the conductors
(Solved)
Figure 8 shows two parallel thick copper conductors connected to a d.c. power supply. A rider made from a thin copper wire is placed on the conductors
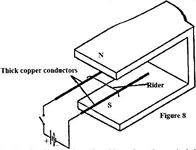
State and explain what is observed on the rider when the switch is closed.
Date posted:
April 19, 2017
.
Answers (1)
-
Figure 2 shows the circuit of a simple telephone receiver
(Solved)
Figure 2 shows the circuit of a simple telephone receiver. When the telephone is lifted a steady current flows through the solenoids. When a person speaks into the microphone on the other side, a varying current flows. These two currents are shown in Figure 2 (b)
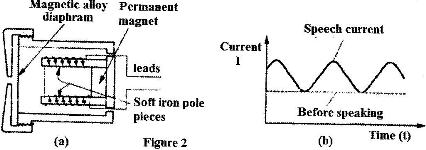
i) State the reason why the solenoids are wound in opposite directions around the soft-iron core pieces as shown.
ii) Explain how the speech current from the microphone is converted into sound in the direction receiver.
iii) State and explain the effect of replacing the soft iron core pieces with steel core pieces
Date posted:
April 19, 2017
.
Answers (1)
-
Figure 16 shows a wire XY at right angles to a magnetic field. XY is part of circuit containing a galvanometer.
(Solved)
Figure 16 shows a wire XY at right angles to a magnetic field. XY is part of circuit containing a galvanometer.
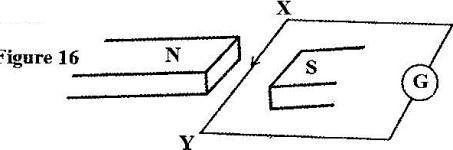
When XY is moved the current flows in the direction shown. State the direction in which XY is moved.
Date posted:
April 19, 2017
.
Answers (1)
-
In the set up in Fig. 5, the suspended metre rule in equilibrium balanced by the magnet and the weight shown. The iron core is fixed to the bench.
(Solved)
In the set up in Fig. 5, the suspended metre rule in equilibrium balanced by the magnet and the weight shown. The iron core is fixed to the bench.

i) State and explain the effect on the metre rule when the switch S, is closed.
ii) What would be the effect of reversing the battery terminals?
iii) Suggest how the set up in figure 5 can be adapted to measure the current flowing in the current circuit.
Date posted:
April 19, 2017
.
Answers (1)
-
Figure 12 shows a set up used to determine the mass of a solid S. The rod is pivoted at its centre of gravity C.
(Solved)
Figure 12 shows a set up used to determine the mass of a solid S. The rod is pivoted at its centre of gravity C.
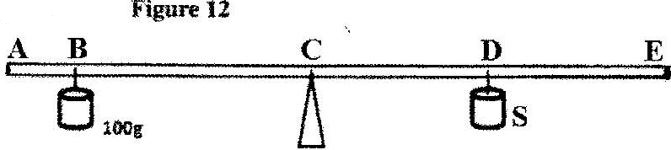
i) State two measurements that need to be made to determine the mass of solid S.
ii) Write an expression to show how the measurements in (i) above are used to obtain the mass of S.
Date posted:
April 19, 2017
.
Answers (1)
-
Figure 1 shows a lorry moving on an inclined section of a straight road. At the back is a chain hanging from a point on a horizontal axis through the centre of gravity of a lorry.
(Solved)
Figure 1 shows a lorry moving on an inclined section of a straight road. At the back is a chain hanging from a point on a horizontal axis through the centre of gravity of a lorry.
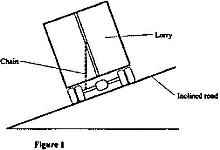
State with a reason whether the lorry is stable or not stable.
Date posted:
April 19, 2017
.
Answers (1)
-
Figure 6 shows an athlete lifting weights while standing with the feet apart
(Solved)
Figure 6 shows an athlete lifting weights while standing with the feet apart
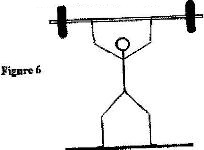
Explain why standing with the feet apart improves the athlete’s stability.
Date posted:
April 19, 2017
.
Answers (2)
-
Figure 3 shows a uniform metre rule pivoted at the 30 cm mark. It is balanced by a weight of 2 N suspended at the 5 cm mark.
(Solved)
Figure 3 shows a uniform metre rule pivoted at the 30 cm mark. It is balanced by a weight of 2 N suspended at the 5 cm mark.
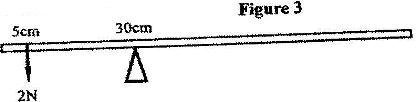
Determine the weight of the metre rule
Date posted:
April 19, 2017
.
Answers (1)
-
Figure 5 shows a uniform bar of length 1.0 m pivoted near one end. The bar is kept in equilibrium by a spring balance as shown.
(Solved)
Figure 5 shows a uniform bar of length 1.0 m pivoted near one end. The bar is kept in equilibrium by a spring balance as shown.
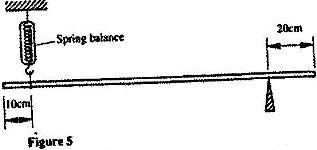
Given that the reading of the spring balance is 0.6 N, determine the weight of the bar
Date posted:
April 19, 2017
.
Answers (1)
-
Figure 3 shows a bimetallic strip with a wooden handle, suspended horizontally using a thin thread.
(Solved)
Figure 3 shows a bimetallic strip with a wooden handle, suspended horizontally using a thin thread.
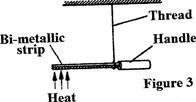
The strip is heated at the point shown. Explain why the system tips to the right
Date posted:
April 19, 2017
.
Answers (1)
-
The system in Figure 9 is in equilibrium.
(Solved)
The system in Figure 9 is in equilibrium.
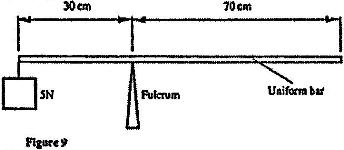
Determine the weight of the bar
Date posted:
April 19, 2017
.
Answers (1)
-
Figure 3 shows a rectangular block of wood with a hollow section (inside) at the position shown. The block is resting on a Horizontal bench
(Solved)
Figure 3 shows a rectangular block of wood with a hollow section (inside) at the position shown. The block is resting on a Horizontal bench
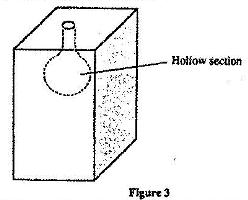
i) State the effect on the stability of the block when the hollow section is filled with water
ii) Explain your answer in (i) above.
Date posted:
April 19, 2017
.
Answers (1)
-
Figure 3 shows two identical trolleys with loads A and B. The loads are identical in shape and size
(Solved)
Figure 3 shows two identical trolleys with loads A and B. The loads are identical in shape and size
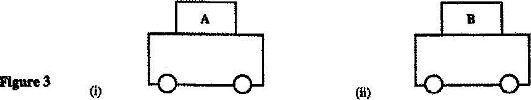
Given that the density of A is greater than that of B, explain why the trolley in Figure 3 (ii) is more stable
Date posted:
April 19, 2017
.
Answers (1)