-
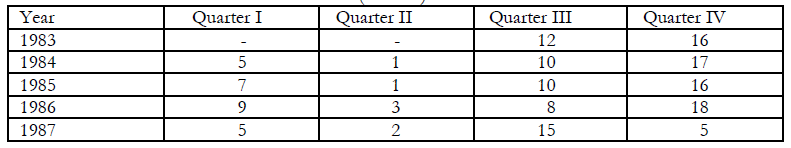
Find the moving average of the time series of quarterly production (in tons) of coffee in an Indian State as given below. After that, come...
(Solved)
Find the moving average of the time series of quarterly production (in tons) of coffee in an Indian State as given below. After that, come up with a trend line to approximate the production in future.
Production (in Tons)
Date posted:
January 11, 2019
.
Answers (1)
-
The following regression equation was calculated for class of 24 CPA II students.
Required:
a) Calculate the t ratio and the 95% confidence interval for each regression...
(Solved)
The following regression equation was calculated for class of 24 CPA II students.

Standard error (0.0190) (0.034) (0.018)
Where y=students score on a theory examination
x1 = Students rank (from the bottom) in high
school x2 = Students verbal aptitude score
x3 =A measure of students character
Required:
a) Calculate the t ratio and the 95% confidence interval for each regression coefficient.
b) What assumptions did you make in (a) above? How reasonable are they?
c) Which regressor gives the strongest evidence of being statistically discernible?
d) In writing up a final regression equation, should one keep the first regressor in the equation, or drop if?
Why?
Date posted:
January 1, 2019
.
Answers (1)
-
Unlisted plc hopes to achieve a Stock Market quotation for its shares. A profit forecast is necessary and, in order to achieve such a forecast,...
(Solved)
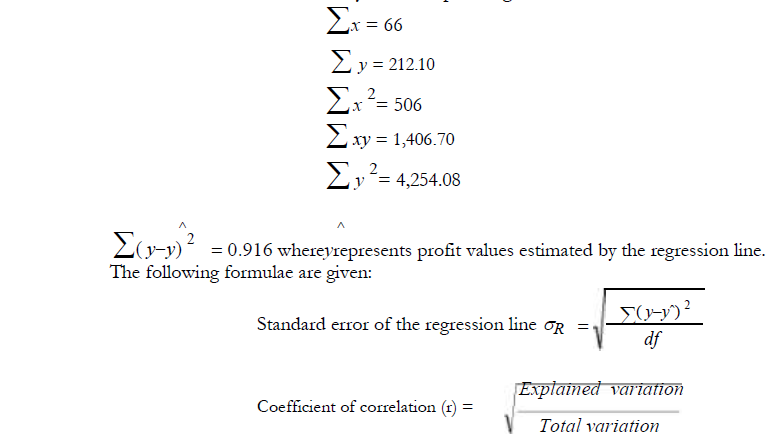
Unlisted plc hopes to achieve a Stock Market quotation for its shares. A profit forecast is necessary and, in order to achieve such a forecast, the company has experimented with a number of approaches. The following are details from a linear regression on the last 11 years profit figures:
x = years (expressed 1 to 11)
y = annual profit figures
You are required:
a) To obtain the simple least squares regression line of Y on X;
b) To use the line to estimate profit in each of the next two years;
c) To calculate the coefficient of determination for the line and to explain its meaning;
d) To calculate the standard error of the regression line and to use this to obtain the 95% confidence
interval for the line;
e) On the basis of the information given on your answer (a) to (d) to determine whether it is likely that the regression line will be a good estimator of profit.
Date posted:
December 14, 2018
.
Answers (1)
-
Two different models are available for the same machine. The production statistics (number of units
produced per hour) of these two models are given below. The...
(Solved)
Two different models are available for the same machine. The production statistics (number of units
produced per hour) of these two models are given below. The data was collected on different days.

Will you conclude that Model A and Model B have the same productivity?
Date posted:
December 8, 2018
.
Answers (1)
-
In each of the following three situations, use binomial, poisson, or normal distribution depending on which is the most appropriate.
In each case, explain why you...
(Solved)
In each of the following three situations, use binomial, poisson, or normal distribution depending on which is
the most appropriate.
In each case, explain why you selected the distribution and draw attention to any feature which supports or
casts doubt on the choice of distribution.
a) Situation 1:
The lifetimes of a certain type of electrical components are distributed with a mean of 800 hours and
standard deviation of 160 hours.
Required:
i) Identify situation 1.
ii) If the manufacturer replaces all the components that fail before the guaranteed minimum lifetime of
600 hours, what percentage of the components have to be replaced?
iii) If the manufacturer wishes to replace only 1% of the components that have the shortest life, what
value should be used as the guaranteed lifetime?
iv) What is the probability that the mean lifetime of a sample of 25 of these electrical components exceeds 850 hours?
b) Situation 2:
A green grocer buys peaches in large consignments directly from wholesaler. In view of the perishable
nature of the commodity, the green grocer accepts that 15% of the supplied peaches will usually be
unsaleable. As he cannot check all the peaches individually, he selects a single batch of 10 peaches on
which to base his decision of whether to purchase a large consignment or not. If no more than two of
these peaches are unsatisfactory, the green grocer purchases the consignment.
Required:
i) Identify situation 2.
ii) Determine the probability that under normal supply conditions, the consignment is purchased.
c) Situation 3:
Vehicles pass a certain point on a busy single-lane road at an average rate of two per 10 second interval.
Required:
i) Identify situation 3.
ii) Determine the probability that more than three cars pass this point during a 20 second interval.
Date posted:
December 8, 2018
.
Answers (1)
-
The purchasing department has analysed the number of orders placed by each of the 5 departments in the
company by type of this financial year as...
(Solved)
The purchasing department has analysed the number of orders placed by each of the 5 departments in the
company by type of this financial year as given in the table below:
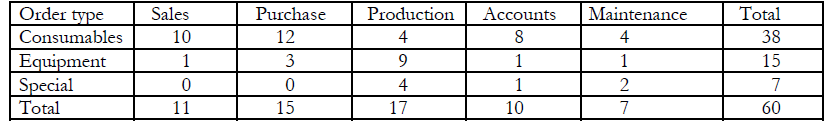
An error has been found in one of these orders.
Required:
i) Determine the probability that the incorrect order was not for consumables.
ii) Determine the probability that the incorrect order came from maintenance or production.
iii) Calculate the probability that the incorrect order was an equipment order from purchase.
Date posted:
December 7, 2018
.
Answers (1)
-
Grear Tyre Company has just developed a new steel-belted radial tyre that will be sold through a chain of discount stores.
Because the tyre is a...
(Solved)
Grear Tyre Company has just developed a new steel-belted radial tyre that will be sold through a chain of discount stores.
Because the tyre is a new product, the company‟s management believes that the mileage guarantee offered
with the tyre will be an important factor in the consumer acceptance of product. Before finalizing the tyre mileage guarantee policy, the actual road test with the tyres shows that the mean tyre
data collected indicate that a normal distribution is a reasonable assumption.
Required:
i) Grear Tyre Company will distribute the tyres if 20 per cent of the tyres manufactured can be expected
to last more than 40,000 kilometers. Should the company distribute the tyres?
ii) The company will provide a discount on a new set of tyres if the mileage on the original tyres does not exceed the mileage stated on the guarantee.
What should the guarantee mileage be if the company wants no more than 10% of the tyres to be
eligible for the discount?
Date posted:
December 7, 2018
.
Answers (1)
-
The past records of Salama Industries indicate that 4 out of 10 of the company?s orders are for
export. Further, their records indicate that 48 percent...
(Solved)
The past records of Salama Industries indicate that 4 out of 10 of the company‟s orders are for
export. Further, their records indicate that 48 percent of all orders are for export in one particular
quarter. They expect to satisfy about 80 orders in the next financial quarter.
Required:
i) Determine the probability that they will break their previous export record
ii) Explain why you have used the approach you have chosen to solve part (i) above.
Date posted:
December 7, 2018
.
Answers (1)
-
An electric utility company has found out that the weekly number of occurrences of lightning striking the
transformers is a Poisson distribution with mean 0.4.
Required:
i) The...
(Solved)
An electric utility company has found out that the weekly number of occurrences of lightning striking the
transformers is a Poisson distribution with mean 0.4.
Required:
i) The probability that no transformer will be struck in a week.
ii) The probability that at most two transformers will be struck in a week.
Date posted:
December 7, 2018
.
Answers (1)
-
In a certain factory that employs 500 men, 2% of all employees have a minor accident in a given year. Of
these, 30% had safety instructions...
(Solved)
In a certain factory that employs 500 men, 2% of all employees have a minor accident in a given year. Of
these, 30% had safety instructions whereas 80% of all employees had no safety instructions.
Required:
Find the probability of an employee being accident-free given that he had:
i) no safety instructions.
ii) safety instructions
Date posted:
December 7, 2018
.
Answers (1)
-
A firm has four plants scattered around the city producing the same homogeneous item at all plants. The first plant produces 30 per cent of...
(Solved)
A firm has four plants scattered around the city producing the same homogeneous item at all plants. The first plant produces 30 per cent of the total production, second plant 25 per cent, third plant 35 per cent and the fourth plant 10 per cent. The firm has a single warehouse in the city for storing the finished product of all the plants without any distinction. From the past performance records on the proportion of defectives, it has been found that 5 per cent, 10 per cent, 15 per cent and 20 per cent from the items produced at plants 1, 2, 3, and 4 respectively are defective. Before the shipment of the items to a dealer, one unit is selected and found defective. What is the probability that the item was produced in plant 3?
Date posted:
December 7, 2018
.
Answers (1)
-
A firm recently submitted a bid for a turnkey project for a 500 MW power plant. If its main competitor submits a bid, the chances...
(Solved)
A firm recently submitted a bid for a turnkey project for a 500 MW power plant. If its main competitor submits a bid, the chances of bid being awarded to the firm is 0.3. If the main competitor doesn't bid, there is a
3/4 chance of the firm getting the contract. There is a 0.50 chance that the main competitor will bid.
i) What is the probability of the firm‟s getting the contract?
ii) What is the probability that the competitor‟s bid given that the firm's bid is awarded?
Date posted:
December 7, 2018
.
Answers (1)
-
Three groups of children contain respectively 3 girls and 1 boy; 2 girls and 2 boys; 1 girl and 3 boys. One child is selected...
(Solved)
Three groups of children contain respectively 3 girls and 1 boy; 2 girls and 2 boys; 1 girl and 3 boys. One child is selected at random from each group, show that the chance that the three selected, consist of 1 girl and 2 boys is 13/32.
Date posted:
December 7, 2018
.
Answers (1)
-
A problem is given to three managers A, B, C whose chances of solving are ½, ?, ¼ respectively. What is the probability that the...
(Solved)
A problem is given to three managers A, B, C whose chances of solving are ½, ⅓, ¼ respectively. What is the probability that the problem will be solved?
Date posted:
December 7, 2018
.
Answers (1)
-
"The standard deviation is the natural partner to the mean". Explain.
(Solved)
"The standard deviation is the natural partner to the mean". Explain.
Date posted:
December 6, 2018
.
Answers (1)
-
Why is the mode not used extensively in statistical analysis?
(Solved)
Why is the mode not used extensively in statistical analysis?
Date posted:
December 6, 2018
.
Answers (1)
-
Describe briefly how to estimate the median on a grouped frequency distribution graphically
(Solved)
Describe briefly how to estimate the median on a grouped frequency distribution graphically.
Date posted:
December 6, 2018
.
Answers (1)
-
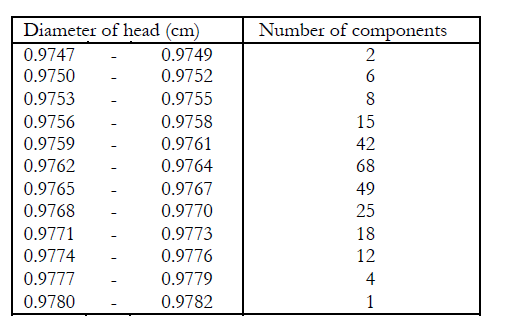
A machine produces circular bolts and, as a quality control test, 250 bolts were selected randomly and
the diameter of their heads measured as follows:
(Solved)
A machine produces circular bolts and, as a quality control test, 250 bolts were selected randomly and
the diameter of their heads measured as follows:
Required:
Determine whether the customer is getting reasonable value if the label on the circular bolt advertises
that the average diameter of the head is 0.97642 cm.
Date posted:
December 6, 2018
.
Answers (1)
-
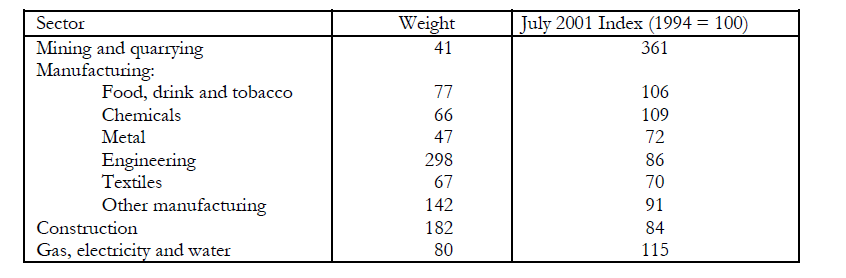
The index of industrial production in the Utopia country by July 2001 is given below:
(Solved)
The index of industrial production in the Utopia country by July 2001 is given below:
Required:
i) Calculate the index of industrial production for all industries and manufacturing industries.
ii) Comment on your results.
Date posted:
December 6, 2018
.
Answers (1)
-
(a) Given the following input – output matrix and demand vector of shoes S, rubber R and glue G industries,
determine the production vector.
(Solved)
(a) Given the following input – output matrix and demand vector of shoes S, rubber R and glue G industries,
determine the production vector.
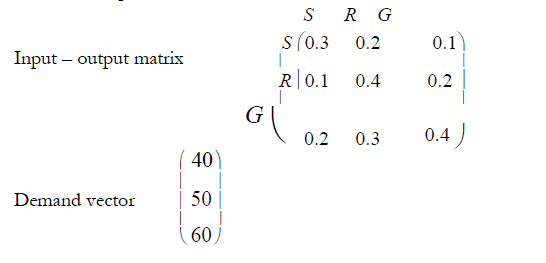
(b) If in (a) above the demand of industries changes as follows:
S decreases by 10 units
R increases by 5 units C
increases by 10 units.
What should be the production levels?
Date posted:
December 6, 2018
.
Answers (1)