(a) Curve 1
(b) The reaction will have reached completion and the amount of reactants and products do not change further.
sharon kalunda answered the question on March 27, 2019 at 05:51
-
The table below gives the solubility of potassium bromide and potassium sulphate at 00C and 400C.
(Solved)
The table below gives the solubility of potassium bromide and potassium sulphate at 00C and 400C.
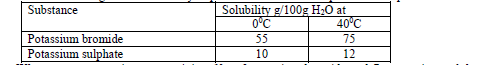
When an aqueous mixture containing 60g of potassium bromide and 7g potassium sulphate in 100g of water at 800C was cooled to 00C, some crystals were formed.
(a) Identify the crystals.
(b) Determine the mass of the crystals.
Date posted:
March 27, 2019
.
Answers (1)
-
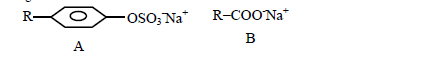
The structure below represents two cleansing agents A and B. Which cleansing agent would be suitable for washing in water containing calcium chloride? Give a...
(Solved)
The structure below represents two cleansing agents A and B. Which cleansing agent would be suitable for washing in water containing calcium chloride? Give a reason.
Date posted:
March 26, 2019
.
Answers (1)
-
The products of a burning candle were passed through a tube containing calcium oxide as shown in the diagram below.
(Solved)
The products of a burning candle were passed through a tube containing calcium oxide as shown in the diagram below.
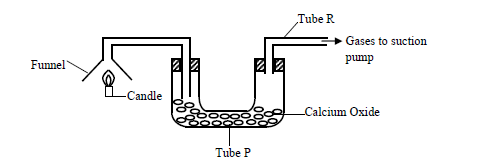
(a) Write two chemical equations for the reactions that took place in tube P.
(b) Name two gases that came out through tube R.
Date posted:
March 26, 2019
.
Answers (1)
-
Excess Carbon (II) Oxide was passed over a heated sample of an oxide of iron as shown in the diagram below. Study the diagram and...
(Solved)
Excess Carbon (II) Oxide was passed over a heated sample of an oxide of iron as shown in the diagram below. Study the diagram and the data and use it to answer the questions that follow
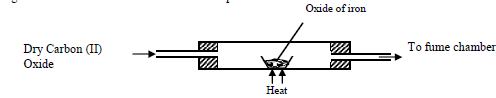
Mass of empty dish =6.72g
Mass of empty dish + oxide of iron =9.04g
Mass of empty dish + residue=8.40g
(a) Determine the formula of the oxide of iron given that the relative formula mass of oxide of Iron = 232, Fe = 56.0, O=16.0
(b) Write an equation for the reaction which took place in the dish
Date posted:
March 26, 2019
.
Answers (1)
-
The diagram below is a cross section of a dry cell. Study it and answer the questions that follow.
(Solved)
The diagram below is a cross section of a dry cell. Study it and answer the questions that follow.
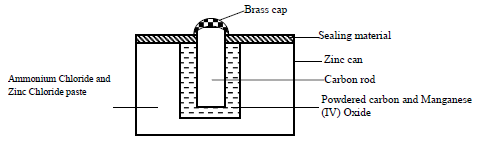
(i) Write the equation for the reaction in which electrons are produced.
(ii) The Zinc can is lined with Ammonium Chloride and Zinc Chloride paste. What would happen if the mixture was to become dry? Give reason.
Date posted:
March 26, 2019
.
Answers (1)
-
What factors should be considered when siting a plant to manufacture sulphuric acid?
(Solved)
What factors should be considered when siting a plant to manufacture sulphuric acid?
Date posted:
March 25, 2019
.
Answers (1)
-
What mass of Lead (II) nitrate could contain 13g of Lead?
(Solved)
What mass of Lead (II) nitrate could contain 13g of Lead?
Date posted:
March 25, 2019
.
Answers (1)
-
How many calcium ions and chloride ions are in 1 mole of calcium chloride, CaCl2?.
(Solved)
How many calcium ions and chloride ions are in 1 mole of calcium chloride, CaCl2?.
Date posted:
March 25, 2019
.
Answers (1)
-
Rates of diffusion of two gases A and B are in the ratio 2:1. If the molecular mass of gas A is 16g. Find the...
(Solved)
Rates of diffusion of two gases A and B are in the ratio 2:1. If the molecular mass of gas A is 16g. Find the molecular mass of B.
Date posted:
March 25, 2019
.
Answers (1)
-
Two gases, A and B have densities of 0.18gdm-3 and 2.90gdm-3 respectively. If they diffuse under the same conditions, what are their relative rates of...
(Solved)
Two gases, A and B have densities of 0.18gdm-3 and 2.90gdm-3 respectively. If they diffuse under the same conditions, what are their relative rates of diffusion.
Date posted:
March 25, 2019
.
Answers (1)
-
Why is it better to use indicators rather than the sense of taste when testing for acids and alkalis?
(Solved)
Why is it better to use indicators rather than the sense of taste when testing for acids and alkalis?
Date posted:
March 25, 2019
.
Answers (1)
-
Explain briefly the following observations about a sample of hard water (a) when boiled it formed some white precipitate (b) even after boiling the water...
(Solved)
Explain briefly the following observations about a sample of hard water (a) when boiled it formed some white precipitate (b) even after boiling the water formed scum with soap (c) Sodium Carbonate made the water completely soft.
Date posted:
March 25, 2019
.
Answers (1)
-
Name the materials used to prepare soaps and soapless detergents.
(Solved)
Name the materials used to prepare soaps and soapless detergents.
Date posted:
March 25, 2019
.
Answers (1)
-
In an experiment, dry hydrogen chloride gas was passed through heated Zinc turnings as shown in the diagram below. The gas produced was then passed...
(Solved)
In an experiment, dry hydrogen chloride gas was passed through heated Zinc turnings as shown in the diagram below. The gas produced was then passed through heated Lead II Oxide.
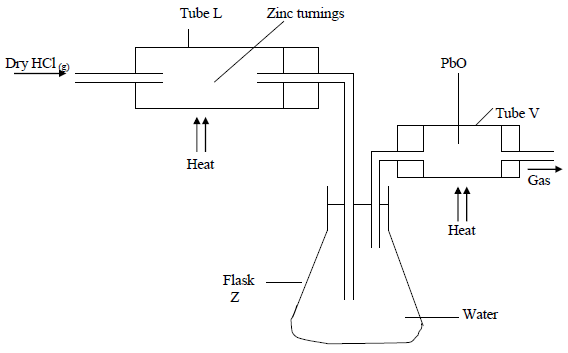
(i) What is the function of the water in the flask?
(ii) Write equations for the reactions that took place in the tubes.
(iii) How would the total mass of tube V and its contents compare before and after the experiment? Explain.
Date posted:
March 25, 2019
.
Answers (1)
-
Paper chromatography of a plant extract gave the following results.
Which Solvent is the most suitable for purifying the extract? Explain.
(Solved)
Paper chromatography of a plant extract gave the following results.
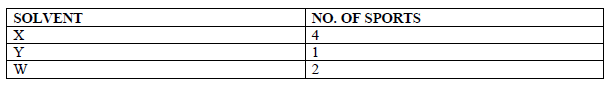
Which Solvent is the most suitable for purifying the extract? Explain.
Date posted:
March 25, 2019
.
Answers (1)
-
Carbon dioxide doesn’t support combustion, yet burning of magnesium ribbon introduced in jar of carbon dioxide continues to burn. Explain this.
(Solved)
Carbon dioxide doesn’t support combustion, yet burning of magnesium ribbon introduced in jar of carbon dioxide continues to burn. Explain this.
Date posted:
March 25, 2019
.
Answers (1)
-
Describe an experiment to investigate the “active part of air”.
(Solved)
Describe an experiment to investigate the “active part of air”.
Date posted:
March 25, 2019
.
Answers (1)
-
Briefly explain how ice-cream vendors use solid carbon dioxide (dry ice) to keep the ice-cream frozen.
(Solved)
Briefly explain how ice-cream vendors use solid carbon dioxide (dry ice) to keep the ice-cream frozen.
Date posted:
March 25, 2019
.
Answers (1)
-
The following are some of the methods used to collect gases. With reasons state which method is suitable for each of the following gases, Ammonia,...
(Solved)
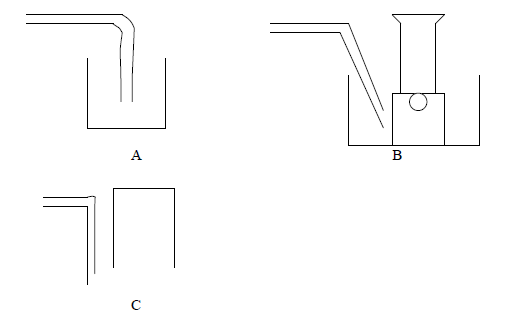
The following are some of the methods used to collect gases. With reasons state which method is suitable for each of the following gases, Ammonia, carbon dioxide, oxygen.
Date posted:
March 25, 2019
.
Answers (1)
-
Where in Kenya is Crystallization method used? State what happens briefly.
(Solved)
Where in Kenya is Crystallization method used? State what happens briefly.
Date posted:
March 25, 2019
.
Answers (1)