-
State and explain two features of a hydrometer that make it sensitive in its function
(Solved)
State and explain two features of a hydrometer that make it sensitive in its function
Date posted:
April 5, 2019
.
Answers (1)
-
The figure below shows a balloon carrying hydrogen gas 3m3 of density 0.09kgm-3. The mass
of the balloon fabric is 2kg and the density of air...
(Solved)
The figure below shows a balloon carrying hydrogen gas 3m3 of density 0.09kgm-3. The mass
of the balloon fabric is 2kg and the density of air is 1.25kgm-3
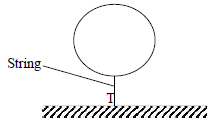
i) Determine the tension in the string
ii) If the string is suddenly cut, calculate the acceleration of the balloon upwards
iii) What is the maximum mass of the equipment the balloon can lift at a constant velocity
Date posted:
April 5, 2019
.
Answers (1)
-
A measuring cylinder contains 50cm3 of light oil at 0oC. When a lump of dried ice is placed in
the oil, the total volume is 72cm3....
(Solved)
A measuring cylinder contains 50cm3 of light oil at 0oC. When a lump of dried ice is placed in
the oil, the total volume is 72cm3. Determine the density of the ice.
Date posted:
April 5, 2019
.
Answers (1)
-
A piece of metal N of mass 2kg weighs 18N in water and 12N in liquid M. Determine the density
of ;
(i) The metal N
(ii) The...
(Solved)
A piece of metal N of mass 2kg weighs 18N in water and 12N in liquid M. Determine the density
of ;
(i) The metal N
(ii) The liquid M
Date posted:
April 5, 2019
.
Answers (1)
-
A bathroom shower has 200 holes each 2.5mm2 in area. Water flows from a pipe of cross-section
area of 15cm2 at 5m/s to the shower. Determine...
(Solved)
A bathroom shower has 200 holes each 2.5mm2 in area. Water flows from a pipe of cross-section
area of 15cm2 at 5m/s to the shower. Determine the speed of the spray.
Date posted:
April 5, 2019
.
Answers (1)
-
A ship of mass 1300 tonnes floats on sea water:
(i) What volume of sea water is displaced (Density of sea water is 1025kg/m3)
(ii) Suppose it...
(Solved)
A ship of mass 1300 tonnes floats on sea water:
(i) What volume of sea water is displaced (Density of sea water is 1025kg/m3)
(ii) Suppose it sails from sea water to fresh water, what cargo must be removed so that
the same volume of water is displaced? (Density of fresh water = 1000kg/m3
Date posted:
April 5, 2019
.
Answers (1)
-
The figure below represents a ray of light falling normally on the curved surface of a
semi- circular glass block A at an angle of 32°...
(Solved)
The figure below represents a ray of light falling normally on the curved surface of a
semi- circular glass block A at an angle of 32° at O and emerging into air at an angle of 48°
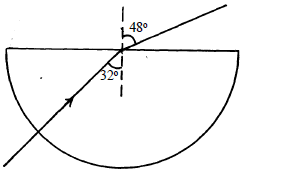
Calculate the absolute refractive index of the glass of which the block is made.
(Assume air is a vacuum)
Date posted:
April 4, 2019
.
Answers (1)
-
The refractive index of paraffin is 1.47 and that of glass is 1.55. Determine the critical
angle of a ray of light travelling from glass to...
(Solved)
The refractive index of paraffin is 1.47 and that of glass is 1.55. Determine the critical
angle of a ray of light travelling from glass to paraffin
Date posted:
April 4, 2019
.
Answers (1)
-
By use of a ray; diagram, show how a concave mirror may be a dentist mirror
(Solved)
By use of a ray; diagram, show how a concave mirror may be a dentist mirror
Date posted:
April 4, 2019
.
Answers (1)
-
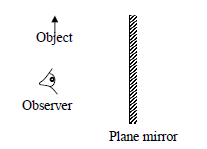
The figure below shows an object placed in front of a plane mirror. Draw appropriate rays to
locate the image as seen by the observer.
(Solved)
The figure below shows an object placed in front of a plane mirror. Draw appropriate rays to
locate the image as seen by the observer.
Date posted:
April 4, 2019
.
Answers (1)
-
The figure below shows a magnetic material being magnetized
(Solved)
The figure below shows a magnetic material being magnetized
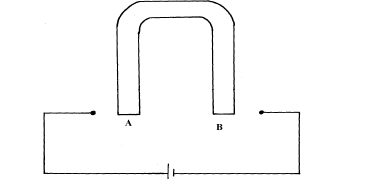
Complete the diagram showing the windings on the magnetic material so as to produce polarities
at A and B both south poles
Date posted:
April 4, 2019
.
Answers (1)
-
The figure below shows a diagram of a simple electric generator
(Solved)
The figure below shows a diagram of a simple electric generator
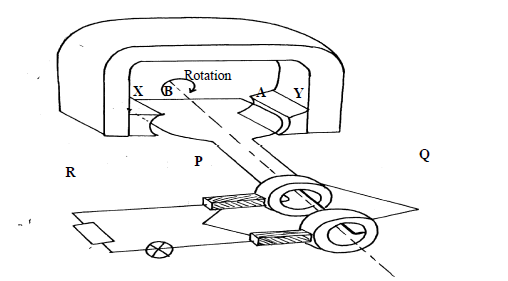
i) Label the parts P and Q
ii) Identify the polarities of the poles X and Y
iii) State two ways of increasing the voltage – output in this generator
Date posted:
April 4, 2019
.
Answers (1)
-
Using a well- labeled diagram explain how a moving coil meter works
(Solved)
Using a well- labeled diagram explain how a moving coil meter works
Date posted:
April 4, 2019
.
Answers (1)
-
Two pins are attached to each of the magnets as shown below.
(Solved)
Two pins are attached to each of the magnets as shown below.
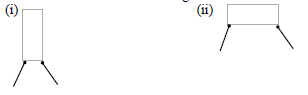
Explain the behaviour of pins in each case.
Date posted:
April 4, 2019
.
Answers (1)
-
The figure below shows a micrometer screw gauge being used to measure the diameter of a rod.
The thimble scale has 50 divisions.
(Solved)
The figure below shows a micrometer screw gauge being used to measure the diameter of a rod.
The thimble scale has 50 divisions.
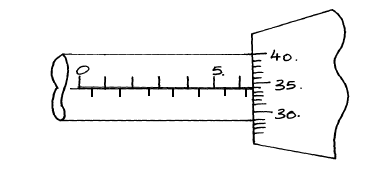
What is the reading?
Date posted:
April 4, 2019
.
Answers (1)
-
A gold leaf electroscope is positively charged as shown in the diagram in figure where C is the cap and L is the gold leaf....
(Solved)
A gold leaf electroscope is positively charged as shown in the diagram in figure where C is the cap and L is the gold leaf. State and explain what happens to L when a positively charged rod is
brought near C without touching it.
Date posted:
April 4, 2019
.
Answers (1)
-
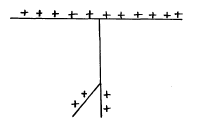
The figure below shows an uncharged pith ball under the attraction of a charged ball.
(Solved)
The figure below shows an uncharged pith ball under the attraction of a charged ball.
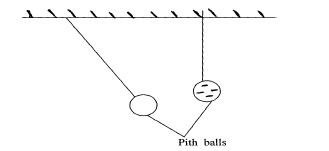
State and explain what would be observed after the two pith balls touch
Date posted:
April 4, 2019
.
Answers (1)
-
A student hung a magnet next to a coil of wire to make a door chime as shown in figure :-
(Solved)
A student hung a magnet next to a coil of wire to make a door chime as shown in figure :-
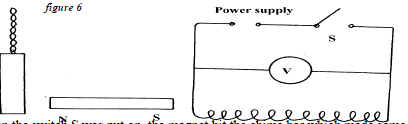
i) Explain how the current made the magnet move towards the chime bar
(ii) What should the student do to make the magnet hit the chime bar harder?
Date posted:
April 4, 2019
.
Answers (1)
-
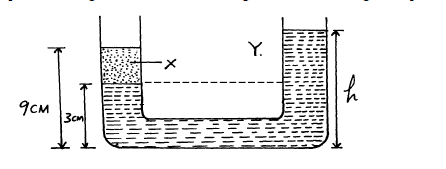
In the diagram below, the U-tube contains two liquids; X and Y which do not mix. If the density
of liquid Y is 900Kgm-3 and that...
(Solved)
In the diagram below, the U-tube contains two liquids; X and Y which do not mix. If the density
of liquid Y is 900Kgm-3 and that of X is 1200Kgm-3, calculate the height of liquid Y
Date posted:
April 4, 2019
.
Answers (1)
-
A minibus of mass 2000kg traveling at a constant velocity of 36km/h collides with a stationary
car of mass 1000kg. The impact takes 2 seconds before...
(Solved)
A minibus of mass 2000kg traveling at a constant velocity of 36km/h collides with a stationary
car of mass 1000kg. The impact takes 2 seconds before the two move together at a constant
velocity for 20 seconds. Calculate:
(i) The common velocity
(ii) The distance moved after impact
(iii) The impulse force
(iv) The change in kinetic energy
Date posted:
April 4, 2019
.
Answers (1)