-
The figure below shows a cone from which a frustum is made. A plane parallel to the base cuts the cone two thirds
way up the...
(Solved)
The figure below shows a cone from which a frustum is made. A plane parallel to the base cuts the cone two thirds
way up the vertical height of the cone to form frustum ABCD. The top surface radius of the frustum is labelled r and the
bottom radius R.

(a) Find the ratio r:R.
(b) Given that r = 7cm, find R.
(c) If the height VY of the original cone is 45cm. Calculate to the nearest whole number the volume of the
frustum. (Take 𝜋 =22/7)
(d) The frustum represents a bucket which is used to fill a rectangular tank measuring 1.5m long, 1.2m wide and
80cm high with water. How many full buckets of water are required to fill the tank.
Date posted:
April 24, 2019
.
Answers (1)
-
A group of people planned to contribute equally towards buying land at a price of Shs 180,000. However 3 members of
the group withdrew from the...
(Solved)
A group of people planned to contribute equally towards buying land at a price of Shs 180,000. However 3 members of
the group withdrew from the project. As a result, each of the remaining members were to contribute KShs. 3000 more.
(a) Find the original number of members in the group.
(b) How much would each person have contributed if the 3 people had not withdrawn.
(c) Calculate the percentage increase in the contribution per person caused by the withdrawal.
Date posted:
April 24, 2019
.
Answers (1)
-
The diagram below represents a right pyramid on a square base of side 3cm. The slant edge of the pyramid is 4cm.
(Solved)
The diagram below represents a right pyramid on a square base of side 3cm. The slant edge of the pyramid is 4cm.
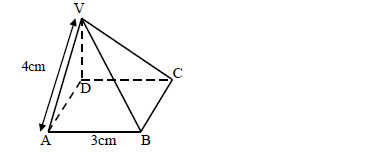
(a) Draw a labelled net of the pyramid.
(b) On the net drawn, measure the height of a triangular face from the top of the pyramid.
Date posted:
April 24, 2019
.
Answers (1)
-
A mother is now 2.5times as old as her daughter Mary. Four years ago the ratio of their ages was 3:1. Find the present
age of...
(Solved)
A mother is now 2.5times as old as her daughter Mary. Four years ago the ratio of their ages was 3:1. Find the present
age of the mother.
Date posted:
April 24, 2019
.
Answers (1)
-
A cylinder of radius 14cm contains water. A metal solid cone of base radius 7cm and height 18cm is submerged into
the water. Find the change...
(Solved)
A cylinder of radius 14cm contains water. A metal solid cone of base radius 7cm and height 18cm is submerged into
the water. Find the change in height of the water level in cylinder.
Date posted:
April 24, 2019
.
Answers (1)
-
A salesman is paid a salary of Sh. 10,000 per month. He is also paid a commission on sales above Sh. 100,000. In one
month he...
(Solved)
A salesman is paid a salary of Sh. 10,000 per month. He is also paid a commission on sales above Sh. 100,000. In one
month he sold goods worth Sh. 500,000. If his total earning that month was Sh. 56,000. Calculate the rate of
commission.
Date posted:
April 24, 2019
.
Answers (1)
-
The interior angle of a regular polygon is 1080 larger than the exterior angle. How many sides has the polygon?
(Solved)
The interior angle of a regular polygon is 1080 larger than the exterior angle. How many sides has the polygon?
Date posted:
April 24, 2019
.
Answers (1)
-
The figure below shows quadrilateral ABCD in which AB = 6cm. BC =1/2CD, CD = DA and angle ADC = angle BCD = 900.
(Solved)
The figure below shows quadrilateral ABCD in which AB = 6cm. BC =1/2CD, CD = DA and angle ADC = angle BCD = 900.
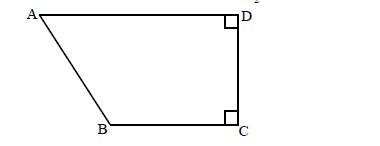
Calculate the area of the quadrilateral ABCD.
Date posted:
April 24, 2019
.
Answers (1)
-
Three sirens wail at intervals of thirty minutes, fifty minutes and thirty-five minutes. If they wail together at 7.18 a.m. on
Monday, what time and day...
(Solved)
Three sirens wail at intervals of thirty minutes, fifty minutes and thirty-five minutes. If they wail together at 7.18 a.m. on
Monday, what time and day will they wail together?
Date posted:
April 24, 2019
.
Answers (1)
-
A circular lawn is surrounded by a path of a uniform width of 7 meters. The area of the path is 21% that of the...
(Solved)
A circular lawn is surrounded by a path of a uniform width of 7 meters. The area of the path is 21% that of the lawn. Calculate the radius of the lawn.
Date posted:
April 23, 2019
.
Answers (1)
-
Two towns P(60° N, 15° W) and Q(60°N, 30°E) are on the same parallel of latitude. An aircraft flying along the parallel of latitude takes...
(Solved)
Two towns P(60° N, 15° W) and Q(60°N, 30°E) are on the same parallel of latitude. An aircraft flying along the parallel of latitude takes 4 hours 10 minutes to fly from P to Q. Taking the radius of the earth to be 6370 km, calculate to the nearest whole number,
i)the distance covered by the aircraft from P to Q
ii)the speed of the aircraft.
Date posted:
April 6, 2019
.
Answers (1)
-
A cold water tap can fill a bath in 6 minutes while a hot water tap can fill it in 12 minutes. The drainage pipe...
(Solved)
A cold water tap can fill a bath in 6 minutes while a hot water tap can fill it in 12 minutes. The drainage pipe can empty the bath in 8 minutes. All the three are opened fully for 3 minutes and then hot water tap is closed. How many more minutes will it take to fill the bath?
Date posted:
April 3, 2019
.
Answers (1)
-
The sum of the first 8 terms of an AP is 236 and the sum of the first 6 terms of the same series is...
(Solved)
The sum of the first 8 terms of an AP is 236 and the sum of the first 6 terms of the same series is 147. Find the sum of the first 12 terms of the series.
Date posted:
April 3, 2019
.
Answers (1)
-
A rectangular tennis court is 10.5m long and 6m wide. Square tiles of 30cm are fitted on the floor.
(a) Calculate the number of tiles needed....
(Solved)
A rectangular tennis court is 10.5m long and 6m wide. Square tiles of 30cm are fitted on the floor.
(a) Calculate the number of tiles needed.
(b) Tiles needed for 15 such rooms are packed in cartons containing 20 tiles. How many cartons are
there in total?
(c) Each carton costs shs. 800. He spends shs. 100 to transport each 5 cartons. How much would one
sell each carton to make 20% profit ?
Date posted:
March 29, 2019
.
Answers (1)
-
A right cone with slant height of 15cm and base radius 9cm has a smaller cone of height 6cm chopped off to form a frustum....
(Solved)
A right cone with slant height of 15cm and base radius 9cm has a smaller cone of height 6cm chopped off to form a frustum. Find the volume of the frustum formed
Date posted:
March 29, 2019
.
Answers (1)
-
The diagram below represents a bucket that has been placed upside down. The radius of the top surface is 15cm and that of the bottom...
(Solved)
The diagram below represents a bucket that has been placed upside down. The radius of the top surface is 15cm and that of the bottom is 40cm. The vertical height of the bucket is 50cm.
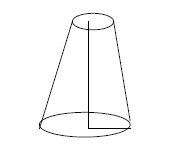
Determine:-
(a) The volume of the bucket.
(b) The curved surface area of the bucket. (leave your answers in terms of π)
Date posted:
March 29, 2019
.
Answers (1)
-
Find the co-ordinates of the turning point on the curve of y = x3 – 3x2 and distinguish between them.
(Solved)
Find the co-ordinates of the turning point on the curve of y = x3 – 3x2 and distinguish between them.
Date posted:
March 29, 2019
.
Answers (1)
-
Two towns T and S are 300km apart. Two buses A and B started from T at the same time travelling towards S. Bus B...
(Solved)
Two towns T and S are 300km apart. Two buses A and B started from T at the same time travelling towards S. Bus B travelled at an average speed of 10km/hr greater than that of A and reached S 1 ¼ hrs earlier.
(a) Find the average speed of A.
(b) How far was A from T when B reached S.
Date posted:
March 29, 2019
.
Answers (1)
-
The marks obtained by Form 4 students in Examination were as follows:
Using 74.5 as the Assumed mean, calculate:
(i) The mean mark
(ii) The standard deviation
(Solved)
The marks obtained by Form 4 students in Examination were as follows:
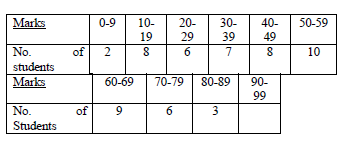
Using 74.5 as the Assumed mean, calculate:
(i) The mean mark
(ii) The standard deviation
Date posted:
March 29, 2019
.
Answers (1)
-
The depth of the water in a rectangular swimming pool increases uniformly from 1M at the shallow
end to 3.5m at the deep end. The pool...
(Solved)
The depth of the water in a rectangular swimming pool increases uniformly from 1M at the shallow
end to 3.5m at the deep end. The pool is 25m long and 12m wide. Calculate the volume of the pool
in cubic meters.
The pool is emptied by a cylindrical pipe of internal radius 9cm. The water flows through the pipe at speed of 3 metres per second. Calculate the number of litres emptied from the pool in two minutes to the nearest 10 litres. (Take π = 3.142)
Date posted:
March 29, 2019
.
Answers (1)