-
In the figure below OY = 20B, OX = 5/2 OA, OA = a and OB = b
(Solved)
In the figure below OY = 20B, OX = 5/2 OA, OA = a and OB = b
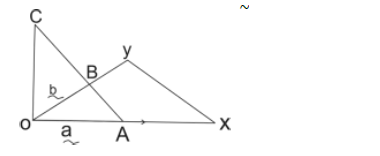
a) Express the following in terms of a and b
(i) AB
(ii) XY
(b) Given that AC = 6AB, express OC & XC interms of a and b
(c) Show the points X, Y and C are collinear
(d) State the ratio in which C divides XY
Date posted:
April 29, 2019
.
Answers (1)
-
The displacement, S metres, of a moving particle after t seconds is given by
S = 40t3 – t2 + 3t + 3. Determine:
(Solved)
The displacement, S metres, of a moving particle after t seconds is given by
S = 40t3 – t2 + 3t + 3. Determine:
(a) The velocity of the particle when t= 3 seconds
(b) The value of t when the velocity of the particle is 4M/S
(c) The displacement when the particle velocity is 4M/S
(d) The acceleration of the particle when t = 3 seconds
Date posted:
April 29, 2019
.
Answers (1)
-
In triangle ABC, BC = 3.2cm, AC = 4.8cm and angle ABC = 1200.
(Solved)
In triangle ABC, BC = 3.2cm, AC = 4.8cm and angle ABC = 1200.
(a) Construct the triangle and a circumscribed circle and measure its radius.
(b) If BC is the base of the triangle, calculate correct to one decimal place.
(i) The perpendicular height of the triangle.
(ii) The area of the minor segment substended by the Chord AC.
(iii) The size of angle ABC
Date posted:
April 29, 2019
.
Answers (1)
-
(a) The product of the matrices is a singular matrix. Find the value of y.
(Solved)
(a) The product of the matrices.
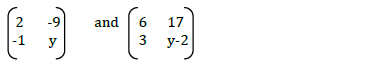
Is a singular matrix. Find the value of y.
(b) In a certain week, a businessman bought 18 bicycles and 16 radios for a total of Kshs. 113,640. In the following week,
he bought 14 bicycles and 12 radius for a total of Kshs. 87,480. Using matrix method, find the price of each bicycle and
each radio that he bought.
(c) In the third week, the price of each bicycle was reduced by 10% while the price of each radio was raised by 10%. The
businessman bought as many bicycles and as many radios as he had bought in the first two weeks. Find by matrix
method, the total cost of the bicycles and radios that the businessman bought in the third week.
Date posted:
April 29, 2019
.
Answers (1)
-
The diagram below shows a cross-section of a bottle. The lower part ABC is a hemisphere of radius 5.2cm and the
upper part is a frustrum...
(Solved)
The diagram below shows a cross-section of a bottle. The lower part ABC is a hemisphere of radius 5.2cm and the upper part is a frustrum of a cone. The top radius of the frustrum is one third of the radius of the hemisphere. The hemisphere part is completely filled with water as shown in the diagram.
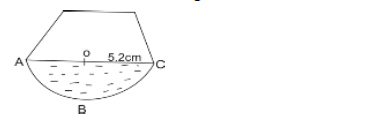
(a) Determine the height of the frustrum part.
(b) Find the surface area of the frustrum part of the bottle.
Date posted:
April 29, 2019
.
Answers (1)
-
The distance between towns M and N is 280km. A car and a lorry travel from M to N.
The average speed of the lorry is...
(Solved)
The distance between towns M and N is 280km. A car and a lorry travel from M to N.
The average speed of the lorry is 20km/h less than that of the car. The lorry takes 1h 10min more than the car to
travel from M to N.
a) If the speed of the lorry is xkm/h, find x
b) The lorry left town M at 8.15am. The car left town M later and overtook the lorry at 12.15pm. Calculate the time the car left town M.
Date posted:
April 29, 2019
.
Answers (1)
-
Y is due East of another point X, a third point Z lies to the North side of XY. A scout stands at Z which...
(Solved)
Y is due East of another point X, a third point Z lies to the North side of XY. A scout stands at Z which is 7km from X
and 8km from Y. If XY = 9km find by scale drawing the bearing of X and Y from the scout at Z.
Date posted:
April 29, 2019
.
Answers (1)
-
On the diagram below, the line whose equation is 7y – 3x + 30 = 0 passes through the points A and B. Point A...
(Solved)
On the diagram below, the line whose equation is 7y – 3x + 30 = 0 passes through the points A and B. Point A is on
the x-axis while point B is equidistant from x- and y-axes.
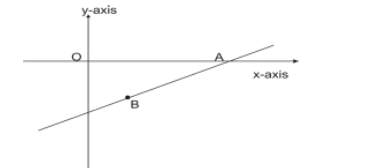
Calculate the co-ordinates of the point A and B
Date posted:
April 29, 2019
.
Answers (1)
-
A trader bought 360 trays of eggs at shs. 120 per tray. He later discovered that 8% of the eggs were bad and could not be...
(Solved)
A trader bought 360 trays of eggs at shs. 120 per tray. He later discovered that 8% of the eggs were bad and could not be sold. If he has to make a profit of 25%, how much should he sell the good eggs per tray.
Date posted:
April 29, 2019
.
Answers (1)
-
A Biology class collected seed pods and weighted them to the nearest gramme. The frequency distribution table is given below.
(Solved)
A Biology class collected seed pods and weighted them to the nearest gramme. The frequency distribution table is given below.
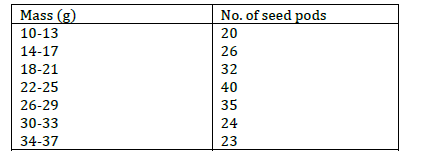
Calculate the Mean Mass
Date posted:
April 29, 2019
.
Answers (1)
-
Factorise completely the expression. 3x2y2 – 8xy - 51
(Solved)
Factorise completely the expression.
3x2y2 – 8xy - 51
Date posted:
April 29, 2019
.
Answers (1)
-
A rectangular locker top cover has dimensions 62cm by 28cm. Find the volume traced by the top cover of the locker when its moved 600...
(Solved)
A rectangular locker top cover has dimensions 62cm by 28cm. Find the volume traced by the top cover of the locker when its moved 600 about its fixed point and horizontal position
Date posted:
April 29, 2019
.
Answers (1)
-
Simplify the expression given below
(Solved)
Simplify the expression given below

Date posted:
April 29, 2019
.
Answers (1)
-
The ratio of Mueni’s earnings to Kilonzo’s earning is 5:3. If Mueni’s earnings is increased by 17% her new figure
becomes Kshs. 18,000. Find the corresponding...
(Solved)
The ratio of Mueni’s earnings to Kilonzo’s earning is 5:3. If Mueni’s earnings is increased by 17% her new figure
becomes Kshs. 18,000. Find the corresponding percentage change in Kilonzi’s earnings if the sum of their new
earnings is Kshs. 24,600.
Date posted:
April 29, 2019
.
Answers (1)
-
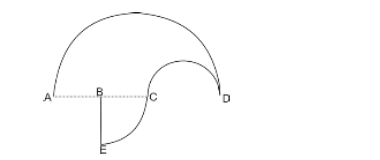
Calculate the perimeter of the figure below, given that AB = BC = BE = 3.3cm
(Solved)
Calculate the perimeter of the figure below, given that AB = BC = BE = 3.3cm
Date posted:
April 29, 2019
.
Answers (1)
-
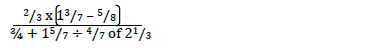
Evaluate without using a calculator
(Solved)
Evaluate without using a calculator
Date posted:
April 29, 2019
.
Answers (1)
-
4x2- 10x + 4y2+ 12y-1 = 0 represents a circle centre C (a, b) and of radius K. Find the values of a, b and...
(Solved)
4x2- 10x + 4y2+ 12y-1 = 0 represents a circle centre C (a, b) and of radius K. Find the values of a, b and K.
Date posted:
April 29, 2019
.
Answers (1)
-
Solve for x given that;
(Solved)
Solve for x given that;

Date posted:
April 29, 2019
.
Answers (1)
-
A merchant blends 350kg of tea costing Sh. 84 kg with 140kg of tea costing Sh. 105 per kg. At what price must he sell
the...
(Solved)
A merchant blends 350kg of tea costing Sh. 84 kg with 140kg of tea costing Sh. 105 per kg. At what price must he sell
the mixture to gain 25%
Date posted:
April 29, 2019
.
Answers (1)
-
Given that x = 31.01, y = 12.9 and w = 0.0023. Calculate the percentage error of ??/xw,give your answer to 4 dp.
(Solved)
Given that x = 31.01, y = 12.9 and w = 0.0023. Calculate the percentage error of 𝑦/xw,give your answer to 4 dp.
Date posted:
April 29, 2019
.
Answers (1)