-
The graph shown below represents Kabugi’s journey from Nairobi to Bungoma and
back.
What was his average speed for the whole journey?
(Solved)
The graph shown below represents Kabugi’s journey from Nairobi to Bungoma and
back.
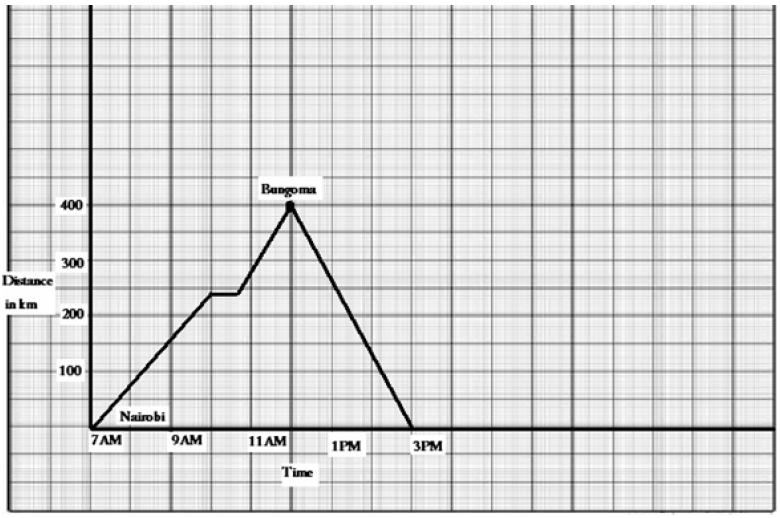
What was his average speed for the whole journey?
Date posted:
May 1, 2019
.
Answers (1)
-
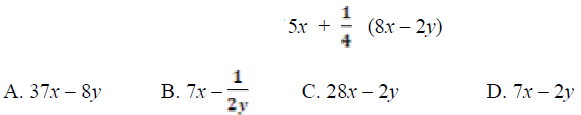
What is the simplified form of
(Solved)
What is the simplified form of
Date posted:
May 1, 2019
.
Answers (1)
-
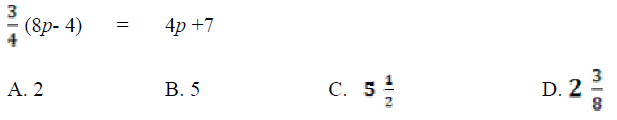
What is the value of p in the equation?
(Solved)
What is the value of p in the equation?
Date posted:
May 1, 2019
.
Answers (1)
-
What is the value of x in the equation?
2(3x – 2) = 3x + 8
(Solved)
What is the value of x in the equation?
2(3x – 2) = 3x + 8
Date posted:
May 1, 2019
.
Answers (1)
-
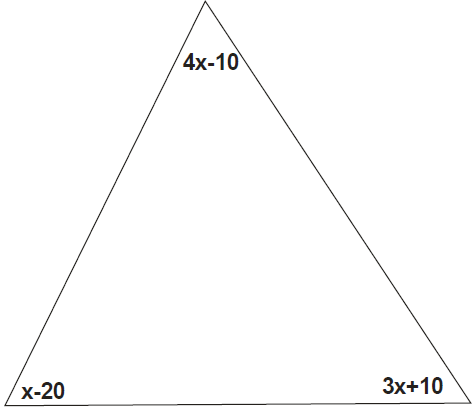
Find the size of the largest angle from the following triangle.
(Solved)
Find the size of the largest angle from the following triangle.
Date posted:
May 1, 2019
.
Answers (1)
-
A rectangle measures 6cm by 2.5 cm. What is the length of the diagonal?
(Solved)
A rectangle measures 6cm by 2.5 cm. What is the length of the diagonal?
Date posted:
May 1, 2019
.
Answers (1)
-
Draw an equilateral triangle A B C where Line AB = 6cm.
Draw a circle touching the 3 vertices of the triangle. What is the radius...
(Solved)
Draw an equilateral triangle A B C where Line AB = 6cm.
Draw a circle touching the 3 vertices of the triangle. What is the radius of the
circle?
Date posted:
May 1, 2019
.
Answers (1)
-
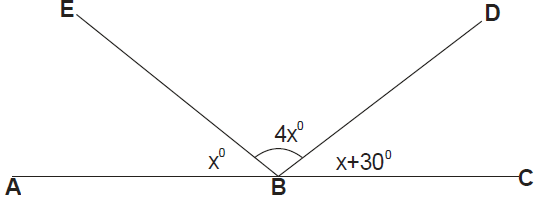
Find the size of angle marked A B D in the figure below.
(Solved)
Find the size of angle marked A B D in the figure below.
Date posted:
May 1, 2019
.
Answers (1)
-
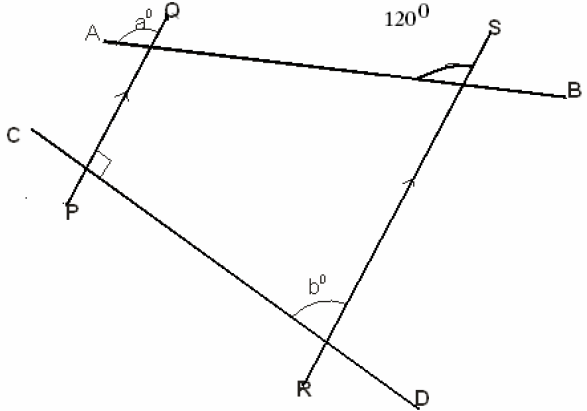
Find the sum of angle “a” and angle “b” in the figure below.
(Solved)
Find the sum of angle “a” and angle “b” in the figure below.
Date posted:
May 1, 2019
.
Answers (1)
-
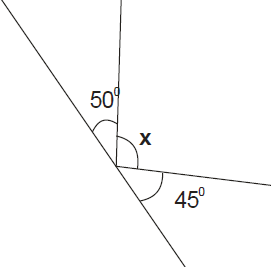
Find the value of x in the following.
(Solved)
Find the value of x in the following.
Date posted:
May 1, 2019
.
Answers (1)
-
The distance between Mombasa and Mtito Andei is 290km. A bus left Mombasa at
1035h and traveled to Mtito Andei at a speed of 50km/h. At...
(Solved)
The distance between Mombasa and Mtito Andei is 290km. A bus left Mombasa at
1035h and traveled to Mtito Andei at a speed of 50km/h. At what time did it arrive at
Mtito Andei?
A. 1623h
B. 1523h
C. 1423h
D. 1723h
Date posted:
May 1, 2019
.
Answers (1)
-
A motorist crosses a bridge at a speed of 25m/s. What is his speed in km/hr?
(Solved)
A motorist crosses a bridge at a speed of 25m/s. What is his speed in km/hr?
A. 80
B. 90
C. 60
D 30
Date posted:
May 1, 2019
.
Answers (1)
-
A Salesperson earns a basic salary of sh7500 per month. He is also paid a 5%
commission on all sales above sh30, 000. In a certain...
(Solved)
A Salesperson earns a basic salary of sh7500 per month. He is also paid a 5%
commission on all sales above sh30, 000. In a certain month his total earnings were
sh.14250. What was his total sales for that month?
A.sh135000
B.sh285000
C.sh165000
D.sh315000
Date posted:
May 1, 2019
.
Answers (1)
-
A shopkeeper bought 3 trays of eggs at sh 150 per tray. On the way to the shop, he
realized 20% of the eggs were broken....
(Solved)
A shopkeeper bought 3 trays of eggs at sh 150 per tray. On the way to the shop, he
realized 20% of the eggs were broken. He sold the rest at sh 72 per dozen. How much
loss did he make?
A.sh450
B.sh432
C.sh18
D.sh28
Date posted:
May 1, 2019
.
Answers (1)
-
The cash price of a microwave is sh. 18000. The hire purchase price of the microwave
is 20% more than the cash price. Bernice bought it...
(Solved)
The cash price of a microwave is sh. 18000. The hire purchase price of the microwave
is 20% more than the cash price. Bernice bought it on hire purchase terms by paying
40% of the hire purchase price as the deposit and the balance equal monthly installments
of sh1620. How many installments did she pay?
A. 12
B. 10
C. 9
D. 8
Date posted:
May 1, 2019
.
Answers (1)
-
Olang’ borrowed sh.54000 from a bank which charged interest at the rate of 18% p.a.
He repaid the whole loan after 8 months .How much did...
(Solved)
Olang’ borrowed sh.54000 from a bank which charged interest at the rate of 18% p.a.
He repaid the whole loan after 8 months .How much did he pay back?
A sh6480
B. sh60,480
C. sh14580
D. sh77760
Date posted:
May 1, 2019
.
Answers (1)
-
A rectangular container whose base measures 40cm by 60cm has 30 liters of water
when full. Find the height of the container in cm.
(Solved)
A rectangular container whose base measures 40cm by 60cm has 30 liters of water
when full. Find the height of the container in cm.
A.0125
B 1.25
C.12.5
D 125
Date posted:
May 1, 2019
.
Answers (1)
-
A cylindrical tank has a radius of 2m and a height of 1.5m. The tank was filled with
water to a depth of 0.5M. What is...
(Solved)
A cylindrical tank has a radius of 2m and a height of 1.5m. The tank was filled with
water to a depth of 0.5M. What is the volume of water in the tank, in litres? (П = 3.14)
A.6280
B.628
C.9240
D.18840
Date posted:
May 1, 2019
.
Answers (1)
-
The diagram below represents a solid triangular prism.
What is the volume in cm3?
(Solved)
The diagram below represents a solid triangular prism.
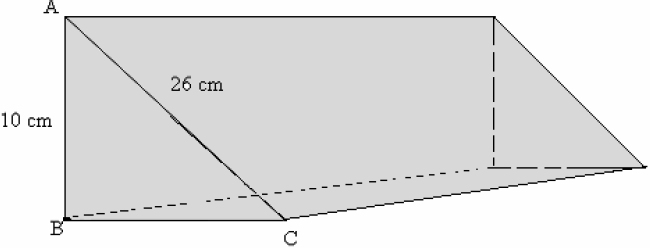
What is the volume in cm3?
A. 2400
B. 2000
C. 5200
D. 576
Date posted:
May 1, 2019
.
Answers (1)
-
A rectangular tank measures 1.2m by 80cm by 50cm. water is poured into the tank to a
height of 15cm. How many more liters of water...
(Solved)
A rectangular tank measures 1.2m by 80cm by 50cm. water is poured into the tank to a
height of 15cm. How many more liters of water are needed to fill the tank?
A.144
B.14.4
C.33.6
D.336
Date posted:
May 1, 2019
.
Answers (1)