-
A line T passes through points (-3, -5) and (3, -6) and is perpendicular to a line l at (-2, -2).
(Solved)
A line T passes through points (-3, -5) and (3, -6) and is perpendicular to a line l at (-2, -2).
a) Find the equation of l.
b) Find the equation of T in the form ax + by = c where a, b and c are constants.
c) Given that another line Q is parallel to T and passes through (1, -3) find x and y intercepts of Q.
d) Find the points of intersection of L and Q.
Date posted:
May 6, 2019
.
Answers (1)
-
A point A (-1, 3) is mapped onto A1(8, 12). Fidn the centre of enlargement given that the scale factor is 2.
(Solved)
A point A (-1, 3) is mapped onto A1(8, 12). Fidn the centre of enlargement given that the scale factor is 2.
Date posted:
May 6, 2019
.
Answers (1)
-
Eight years ago the age of a father was six times the age of his son and after eight years from today the age of...
(Solved)
Eight years ago the age of a father was six times the age of his son and after eight years from today the age of the
father would be only twice the age of his son. Find their present ages.
Date posted:
May 6, 2019
.
Answers (1)
-
The sum of interior angles of a regular polygon is 32400. Find the size of each exterior angle.
(Solved)
The sum of interior angles of a regular polygon is 32400. Find the size of each exterior angle.
Date posted:
May 6, 2019
.
Answers (1)
-
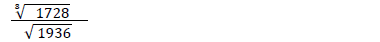
Use the prime factors of 1936 and 1728 to evaluate.
(Solved)
Use the prime factors of 1936 and 1728 to evaluate.
Date posted:
May 6, 2019
.
Answers (1)
-
The eleventh term of an arithmetic progression is four times its second term. The sum of the first seven terms of
the same progression is 175.Find...
(Solved)
The eleventh term of an arithmetic progression is four times its second term. The sum of the first seven terms of
the same progression is 175.Find the first term and the common difference of the progression
Date posted:
May 6, 2019
.
Answers (1)
-
A tea blender buys two grades of tea at Sh. 60 and Sh. 80 per packet. Find the ratio in which she should mix them...
(Solved)
A tea blender buys two grades of tea at Sh. 60 and Sh. 80 per packet. Find the ratio in which she should mix them so
that by selling the mixture at Sh. 90, a profit of 20% is realized.
Date posted:
May 6, 2019
.
Answers (1)
-
A water tank has a capacity of 50 litres. A similar model tank has a capacity of 0.25 litres. If the larger tank has a...
(Solved)
A water tank has a capacity of 50 litres. A similar model tank has a capacity of 0.25 litres. If the larger tank has a height
of 10cm. Calculate the height of the model tank, to the nearest cm.
Date posted:
May 6, 2019
.
Answers (1)
-
There are two boxes labeled A and B on a table. Box A contains 5 red balls and 3 white balls, while box B contains...
(Solved)
There are two boxes labeled A and B on a table. Box A contains 5 red balls and 3 white balls, while box B contains 2 red
balls and 6 white balls. A box is chosen at a random and two balls are drawn from it, one after the other without
replacement. Find the probability that the two balls chosen are of different colours
Date posted:
May 6, 2019
.
Answers (1)
-
If (x+y) : (x-y)=8:3 find the ratio x:y
(Solved)
If (x+y) : (x-y)=8:3 find the ratio x:y
Date posted:
May 6, 2019
.
Answers (1)
-
Use logarithm tables to evaluate
(Solved)
Use logarithm tables to evaluate

Correct to 3 significant figures
Date posted:
May 6, 2019
.
Answers (1)
-
A survey recorded the measurement of a field book using XY = 400m as the base line as shown below.
(Solved)
A survey recorded the measurement of a field book using XY = 400m as the base line as shown below.
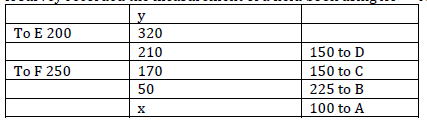
Find the area of the field in hectares.
Date posted:
May 6, 2019
.
Answers (1)
-
A piece of wire can be folded into a rectangle whose dimensions are such that its length is 3cm longer than the width.
The area of...
(Solved)
A piece of wire can be folded into a rectangle whose dimensions are such that its length is 3cm longer than the width.
The area of the rectangle so formed is 28m2.
(a) Determined
(i) The dimensions of the rectangle
(ii) The perimeter of the rectangle
(b) The wire can also be folded into a circle. Taking 𝜋 =22/7.Find the radius of the circle and hence calculate its area.
Date posted:
May 6, 2019
.
Answers (1)
-
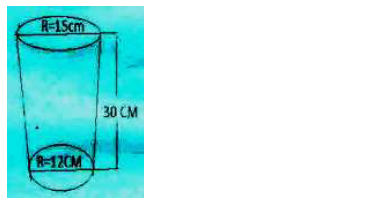
The diagram below shows a frustum which represents a bucket with an open top diameter of 30cm and a bottom
diameter of 24cm. The bucket is...
(Solved)
The diagram below shows a frustum which represents a bucket with an open top diameter of 30cm and a bottom
diameter of 24cm. The bucket is 30cm deep and it is used to fill an empty cylindrical tank of diameter 1.4m and height
of 1.2m.
(a) Leaving your answer in terms of 𝜋 calculate
(i) The capacity of the bucket in litres
(ii) The capacity of the tank in litres
(b) Determine the number of bucket that must be drawn in order to fill that tank
Date posted:
May 6, 2019
.
Answers (1)
-
The distance between town A and B is 360km. A minibus left A at 8.15 am and travelled towards B at an average
speed of 90km/h....
(Solved)
The distance between town A and B is 360km. A minibus left A at 8.15 am and travelled towards B at an average
speed of 90km/h. A matatu left B two and a third hours later on the same day and travelled towards A at an average
speed of 110km/hr.
(a) (i) At what time did the two vehicles meet?
(ii) How far from A did the vehicles meet
(b) A motorist started from his home at 10.30 am on the same day and travelled at an average speed of 100km/hr. He
arrived at B at the same time as the minibus. Calculate the distance from A to his house.
Date posted:
May 6, 2019
.
Answers (1)
-
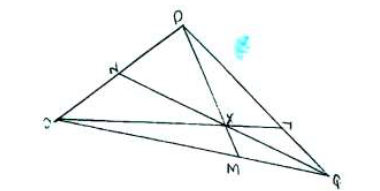
The figure below shows triangle OPQ in which OP = P and OQ = p. M and N are points on OQ and OP respectively...
(Solved)
The figure below shows triangle OPQ in which OP = P and OQ = p. M and N are points on OQ and OP respectively such
that ON:NP = 1:3 and OM:MQ = 2:1
(a) Express the following vectors in terms of p and q
(i) PM
(ii) QN
(iii) PQ
(b) Lines PM and QN intersect at X such that PX = hPM and QX = kQN. Express OX in two different ways and hence
find the value of h and k.
(c) OX produced meets PQ at Y such that PY :YQ = 3:2. Using the ratio theorem or otherwise, find OY in terms of P and q
Date posted:
May 6, 2019
.
Answers (1)
-
The number 5.81 contains an integral part and a recurring decimal. Convert the number into an improper fraction and hence into a mixed number
(Solved)
The number 5.81 contains an integral part and a recurring decimal. Convert the number into an improper fraction and hence into a mixed number
Date posted:
May 6, 2019
.
Answers (1)
-
Sales lady sold goods whose marked price was Sh. 340,000 at a discount of 3%. She was paid Sh. 16,490 as a commission for this...
(Solved)
Sales lady sold goods whose marked price was Sh. 340,000 at a discount of 3%. She was paid Sh. 16,490 as a commission for this sale. Calculate the percentage rate of commission she was paid.
Date posted:
May 6, 2019
.
Answers (1)
-
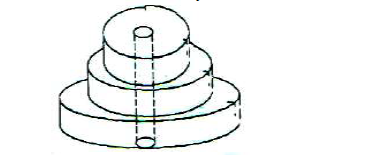
A solid consists of three discs each of 1.5cm thick with diameter of 4cm, 6cm and 8cm respectively. A central hole 2cm
in a diameter is...
(Solved)
A solid consists of three discs each of 1.5cm thick with diameter of 4cm, 6cm and 8cm respectively. A central hole 2cm
in a diameter is drilled out as shown below. If the density of the material used is 2.8cm3, calculate it mass to 1 decimal place.
Date posted:
May 6, 2019
.
Answers (1)
-
Given that Log3 = 0.4771 and log 5 = 0.6990, evaluate the following without using logarithm table or calculator.
(Solved)
Given that Log3 = 0.4771 and log 5 = 0.6990, evaluate the following without using logarithm table or calculator.
(a) Log 135
(b) Log 1125
Date posted:
May 6, 2019
.
Answers (1)