-
a.) Determine the inequalities that define the unshaded region below
(Solved)
a.) Determine the inequalities that define the unshaded region below
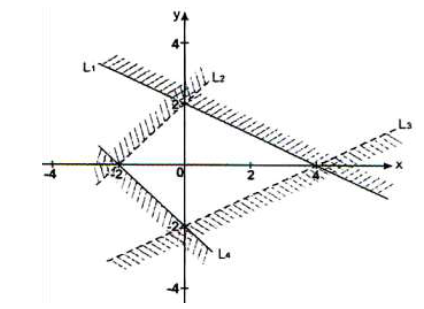
b) calculate the area of the unshaded region
Date posted:
May 7, 2019
.
Answers (1)
-
OABC is a trapezium in which OA = a and AB = b. AB is parallel to OC with 2AB = OC. T is a...
(Solved)
OABC is a trapezium in which OA = a and AB = b. AB is parallel to OC with 2AB = OC. T is a point on OC produced sothat OC: CT = 2:1. AT and BC intersect at X. So that BX = hBC and AX = kAT
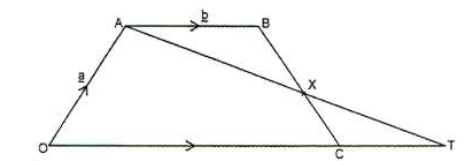
a) Express the following in terms a and b.
i) OB
ii) BC
b) Express CX in terms of a, b, and h.
c) Express CX in terms of a, b, and k.
d) Hence calculate the values of h and k
Date posted:
May 7, 2019
.
Answers (1)
-
The probability of Owino going to school by tuktuk is ¼ while that of going by boda boda is 2/5 .If he travels by tuktuk,
the...
(Solved)
The probability of Owino going to school by tuktuk is ¼ while that of going by boda boda is 2/5 .If he travels by tuktuk,
the probability of arriving in school late is 1/7 whereas that of the boda boda is 1/3. If he uses other means , the
probability of him getting to school late is 1/10
a) Draw a tree diagram to represent the above information.
b) Calculate the probability that:
i) He is late for school.
ii) He is not late for school
iii) He is late for school if he does not use boda boda.
Date posted:
May 7, 2019
.
Answers (1)
-
Find the equation of the normal to the curve y = 3x2 - 8x+5 at the point where x = 2 in the form ax...
(Solved)
Find the equation of the normal to the curve y = 3x2 - 8x+5 at the point where x = 2 in the form ax + by = c
Date posted:
May 7, 2019
.
Answers (1)
-
The quantities P and Q are such that P varies partly as Q and partly as the square of Q. When q = 60 and...
(Solved)
The quantities P and Q are such that P varies partly as Q and partly as the square of Q. When q = 60 and when Q = 3, P
= 105.
a) Write the equation connecting P and Q.
b) Find the value of P when Q = 5
Date posted:
May 7, 2019
.
Answers (1)
-
Determine the centre and radius of a circle whose equation is given by 2x2 + 2y2 - 8x + 4y + 2 = 0
(Solved)
Determine the centre and radius of a circle whose equation is given by 2x2 + 2y2 - 8x + 4y + 2 = 0
Date posted:
May 7, 2019
.
Answers (1)
-
In the figure below, AT is a tangent to the circle at A. AB and CD intersect at X. Give that BX = 4 cm,...
(Solved)
In the figure below, AT is a tangent to the circle at A. AB and CD intersect at X. Give that BX = 4 cm, CX = 6cm, CD = 12
cm and AT = 8cm , calculate:
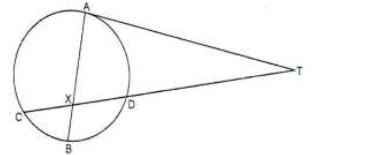
a) the legth of AX
b) the length of secant CT.
Date posted:
May 7, 2019
.
Answers (1)
-
a) Expand (1 – 2x)6 upto to the fourth term.
(Solved)
a) Expand (1 – 2x)6 upto to the fourth term.
b) Use the expansion in (a) above to find the value of (0.98)6 correct to 4 significant figures.
Date posted:
May 7, 2019
.
Answers (1)
-
The base and the height of a right angled triangle were measured as 4.34 cm and 8.25 cm respectively.Calculate the percentage error in the area...
(Solved)
The base and the height of a right angled triangle were measured as 4.34 cm and 8.25 cm respectively.Calculate the percentage error in the area of the triangle.
Date posted:
May 7, 2019
.
Answers (1)
-
Simplify the expression.
(Solved)
Simplify the expression.

Date posted:
May 7, 2019
.
Answers (1)
-
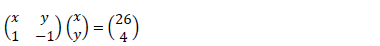
Solve for x and y given that.
(Solved)
Solve for x and y given that.
Date posted:
May 7, 2019
.
Answers (1)
-
Find the interquartile range of the data below:
2,4,6,8,10,5,6,9,4,6
(Solved)
Find the interquartile range of the data below:
2,4,6,8,10,5,6,9,4,6
Date posted:
May 7, 2019
.
Answers (1)
-
Solve for x in the equation. Sin (2x – 10)0 = -0.5 for 00= x= 3600
(Solved)
Solve for x in the equation. Sin (2x – 10)0 = -0.5 for 00≤ x≤ 3600
Date posted:
May 7, 2019
.
Answers (1)
-
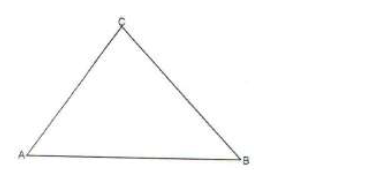
In the triangle below, a point R moves such that the area of ? ACB = area of ? ARB and < ARB = 300....
(Solved)
In the triangle below, a point R moves such that the area of Δ ACB = area of Δ ARB and < ARB = 300. Using a ruler and
a pair of compasses only, locate the possible position of R on the same side as C and find the distance between them.
Date posted:
May 7, 2019
.
Answers (1)
-
A point divides line PQ in the ratio 3: -2. Given that P = 2i -3j + k and Q = 3i -4j – 3k...
(Solved)
A point divides line PQ in the ratio 3: -2. Given that P = 2i -3j + k and Q = 3i -4j – 3k find the coordinates of T.
Date posted:
May 7, 2019
.
Answers (1)
-
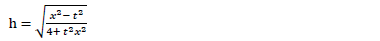
Make x the subject of the formula
(Solved)
Make x the subject of the formula
Date posted:
May 7, 2019
.
Answers (1)
-
Use logarithm tables to evaluate:
(Solved)
Use logarithm tables to evaluate:

Date posted:
May 7, 2019
.
Answers (1)
-
In the figure below, AT and AD are tangents to the circle at B and D respectively. DEF is a straight line, < ?????? =...
(Solved)
In the figure below, AT and AD are tangents to the circle at B and D respectively. DEF is a straight line, < 𝐶𝐵𝑇 = 600, 0 and < ADF = 420
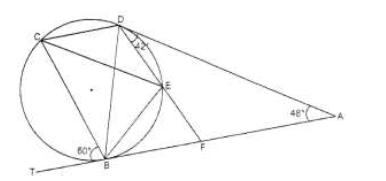
Calculate giving reasons, the value of:
a) < DCE
b) c) d) e)
Date posted:
May 6, 2019
.
Answers (1)
-
A pole stands directly across the street from a building. The angle of depression of the top of the building from the top
of the pole...
(Solved)
A pole stands directly across the street from a building. The angle of depression of the top of the building from the top
of the pole is 24.50 and the angle of elevation of the top of the pole from the foot of the building is 48.60. Given that the
distance between the pole and the building is 50 m, calculate to 2 decimal places.
a) the height of the pole
b) the difference in height between the pole and the building.
c) the height of the building.
d) the angle of elevation of the top of the building from the top of the pole.
Date posted:
May 6, 2019
.
Answers (1)
-
A triangular plot PQR is such that PQ = 72m, QR = 80m and PR = 84m
(Solved)
A triangular plot PQR is such that PQ = 72m, QR = 80m and PR = 84m
calculate.
i) the area of the plot in square metres
ii) the largest angle in the triangle
iii) The perpendicular height from P to the side QR
Date posted:
May 6, 2019
.
Answers (1)