(i) 8.1 from the graph
(ii)Reading mass after 16.2days from graph = 100g
100/400 = ¼
sharon kalunda answered the question on May 16, 2019 at 11:33
-
Define the following terms
(Solved)
Define the following terms
(i) Nuclear fission
(ii) Nuclear fussion.
Date posted:
May 16, 2019
.
Answers (1)
-
The scheme below represents some reaction involving hydrocarbons. Study it and
answer the questions that follow.
(Solved)
The scheme below represents some reaction involving hydrocarbons. Study it and
answer the questions that follow.
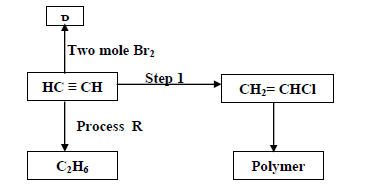
(i) Name Compound P.
(ii) Draw the structural formula of P.
(iii) Name the reagent and type of reaction taking place in process R.
(iv) What is a polymer.
(v) Identify the reagent used in Step 1
Date posted:
May 16, 2019
.
Answers (1)
-
Write an equation of reaction between ethene and chlorine gas and name the
product.
(Solved)
Write an equation of reaction between ethene and chlorine gas and name the
product.
Date posted:
May 16, 2019
.
Answers (1)
-
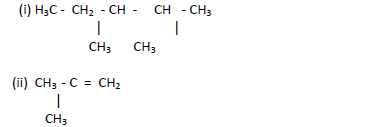
Name the following compounds.
(Solved)
Name the following compounds.
Date posted:
May 16, 2019
.
Answers (1)
-
Lead (II) ions react with iodide ions according to the equation
(Solved)
(i) Lead (II) ions react with iodide ions according to the equation

300cm3 of 0.1M solution of iodide ions was added to a solution containing Lead (II)
ions. Calculate the mass of Lead (II) iodide formed (Pb= 207, I = 127).
(ii) Identify the colour of the product formed after the reaction above.
Date posted:
May 16, 2019
.
Answers (1)
-
(i) State and explain what is observed when ammonia solution is gradually added to a solution of Lead (II) nitrate until the alkali (ammonia) is...
(Solved)
(i) State and explain what is observed when ammonia solution is gradually added to a solution of Lead (II) nitrate until the alkali (ammonia) is in excess.
(ii) Write an equation for the reaction that takes place in (i) above
Date posted:
May 16, 2019
.
Answers (1)
-
When Lead (II) nitrate crystals is heated strongly the crystals crackle and split because
of the gas accumulating inside.
(Solved)
When Lead (II) nitrate crystals is heated strongly the crystals crackle and split because
of the gas accumulating inside.
(i) State three other observations that are made.
(ii) Write an equation for the reaction that takes place when Lead (II) nitrate is
strongly heated.
Date posted:
May 16, 2019
.
Answers (1)
-
(i) Describe how Lead(II) nitrate is prepared in the Laboratory starting from Lead (II) Oxide.
(ii) Write an equation for the reaction that takes place in...
(Solved)
(i) Describe how Lead(II) nitrate is prepared in the Laboratory starting from Lead (II) Oxide.
(ii) Write an equation for the reaction that takes place in (i) above
Date posted:
May 16, 2019
.
Answers (1)
-
Explain the following. When concentrated sulphulric acid is added to copper turnings and the mixture heated, a reaction takes places producing a blue solution as...
(Solved)
Explain the following. When concentrated sulphulric acid is added to copper turnings and the mixture heated, a reaction takes places producing a blue solution as one of the products, but when dilute sulphuric acid is added to copper turnings there is no charge even after heating.
Date posted:
May 16, 2019
.
Answers (1)
-
The chart below shows some of the chemical needed for the production of ammonia gas, nitric
acid and ammonia sulphate in the industry.
(Solved)
The chart below shows some of the chemical needed for the production of ammonia gas, nitric
acid and ammonia sulphate in the industry.
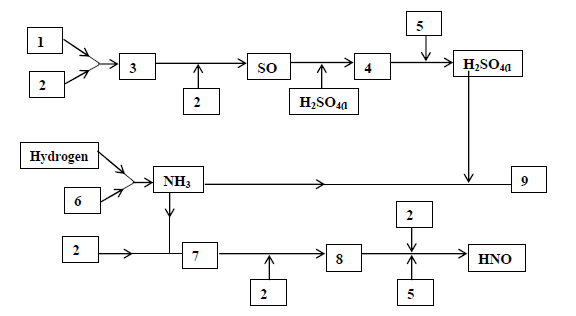
(a) Name the chemical that should be in chambers 1,2, 4, 6, 8 and 9
b) State three conditions required to convert the chemical substance in chamber 3 to
SO3(g).
c) Write balanced equations with conditions where necessary for the reactions that
produces chemical substances in chambers:-
Date posted:
May 16, 2019
.
Answers (1)
-
The table below shows the atomic numbers of some elements represented by letter J to Q ( letters
not their actual symbols). Study and answer the...
(Solved)
The table below shows the atomic numbers of some elements represented by letter J to Q ( letters
not their actual symbols). Study and answer the questions that follow.
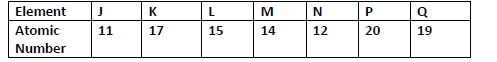
a) Write the electronic configuration of
(i) M
(ii) P2+
b) Write the formula of the compound formed when L combines with N
c) How would reactivities of element N and P with chlorine compare? Explain.
d) Element N combines with oxygen to from an oxide. Using dots (.) and crosses(x) to
represent the outermost electrons, show how the two elements combine.
e) Select the most reactive metal and non-metal and give reason for your answer.
f) State one physical and one chemical property that elements J and Q have in common
g) What name is given to the group of elements to which element M belong?
h) (i) Element K consists of two isotopes with relative abundances 75% and 25% and
mass number 35 and 37 respectively find the relative atomic mass of K.
(ii) Why is the relative atomic mass of K not a whole number?
Date posted:
May 13, 2019
.
Answers (1)
-
The table below shows solubilities of two salts M and N at different temperatures. Study it and
answer the questions that follow.
(Solved)
The table below shows solubilities of two salts M and N at different temperatures. Study it and
answer the questions that follow.
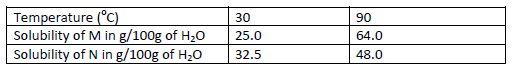
A mixture of 55g of salt M in 100g of water and 30g of salt N in 100g of water were cooled from 90oC to 30oC . Calculate the mass of salt that crystallize out.
Date posted:
May 13, 2019
.
Answers (1)
-
The diagram below shows a Bunsen burner when in use
(Solved)
The diagram below shows a Bunsen burner when in use
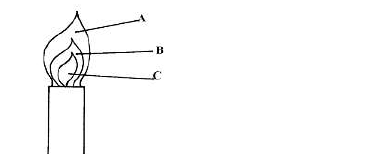
Which of the labeled parts is used for heating? Give a reason
Date posted:
May 13, 2019
.
Answers (1)
-
During the extraction of lead from its ores one of the main ore used is Galena
(Solved)
During the extraction of lead from its ores one of the main ore used is Galena
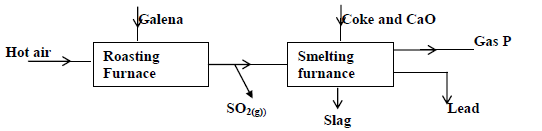
(i) Write an equation for the reaction in roasting furnace.
(ii) Name gas
(iii) State one use of lead metal.
Date posted:
May 13, 2019
.
Answers (1)
-
Study the scheme below and use it to answer the questions that follows.
(Solved)
Study the scheme below and use it to answer the questions that follows.
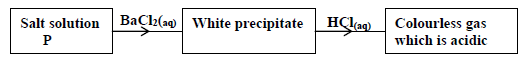
Write down the formulae of two possible anions present in salt solution P.
Date posted:
May 13, 2019
.
Answers (1)
-
During a displacement reaction, excess iron powder was added to 25cm3 of 0.5 M copper (II) sulphate solutions. The temperature rose from 18.5oC to 33.0oC....
(Solved)
During a displacement reaction, excess iron powder was added to 25cm3 of 0.5 M copper (II) sulphate solutions. The temperature rose from 18.5oC to 33.0oC. Calculate the molar enthalpy of displacement of copper in copper (II) sulphate solution (Specific heat capacity is 4.2 Jg-1K-1, Density of the solution = 1.0g/cm3)
Date posted:
May 13, 2019
.
Answers (1)
-
Describe how you would prepare crystals of sodium nitrate starting with 200cm3 of 2M
sodium hydroxide.
(Solved)
Describe how you would prepare crystals of sodium nitrate starting with 200cm3 of 2M
sodium hydroxide.
Date posted:
May 13, 2019
.
Answers (1)
-
The diagram below shows a set –up for preparation of hydrogen chloride gas.
(Solved)
The diagram below shows a set –up for preparation of hydrogen chloride gas.
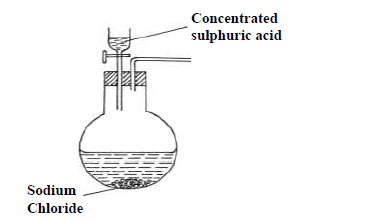
Write the equation for the reaction that produces hydrogen chloride gas.
Date posted:
May 13, 2019
.
Answers (1)
-
The following table gives the melting points of oxides of elements in period 3. Study it and
answer the questions that follow:-
(Solved)
The following table gives the melting points of oxides of elements in period 3. Study it and
answer the questions that follow:-
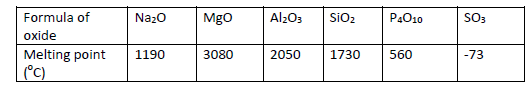
(i) Explain the difference in melting points of MgO and P4O10
(ii) Name the compound in the above table that will dissolve both in dilute
hydrochloride acid and dilute sodium hydroxide.
Date posted:
May 13, 2019
.
Answers (1)
-
36cm3 of a solution of potassium hydroxide requires 25cm3 of 0.5M sulphuric acid to
neutralize it.Calculate the concentration of alkali in g/dm3
(Solved)
36cm3 of a solution of potassium hydroxide requires 25cm3 of 0.5M sulphuric acid to
neutralize it.Calculate the concentration of alkali in g/dm3
Date posted:
May 13, 2019
.
Answers (1)