-
State and explain factors that have turned to frustrate economic developments in a country like Kenya.
(Solved)
State and explain factors that have turned to frustrate economic developments in a country like Kenya.
Date posted:
May 12, 2019
.
Answers (1)
-
The following balances were extracted from the books of Highlife
General Stores on 31st December 2015.
Item ...
(Solved)
The following balances were extracted from the books of Highlife
General Stores on 31st December 2015.
Item Ksh
Land and buildings 650,000
Stock 470,000
Bank overdraft 80,000
Debtors 350,000
10 year Bank Loan 500,000
Creditors 220,000
Cash 50,000
Motor Van 150,000
Capital ?
Required: Prepare the balance sheet of Highlife General Stores as at 31st
December 2015.
Date posted:
May 8, 2019
.
Answers (1)
-
On 1st September 2015, Gondi had Ksh 55,000 in hand and Ksh
250,000 at bank. During the month, the following transactions took place:
September 2 Cash sales...
(Solved)
On 1st September 2015, Gondi had Ksh 55,000 in hand and Ksh
250,000 at bank. During the month, the following transactions took place:
September 2 Cash sales banked Ksh 35,260
3 Bought ribbons in cash Ksh 4,500
8 Paid Wangila, a creditor Ksh 94,000 by cheque in full settlement
of his account after deducting 6% cash discount
12 Received a cheque for Ksh 58,800 from Wetu after allowing her a
cash discount of Ksh 1,200
15 Paid salaries Ksh 34,000 in cash
25 Withdrew Ksh 50,000 from bank for office use
28 Anyango, a debtor paid her account of Ksh 75,000 by cheque less
10% - cash discount
30 Deposited all the cash into bank except Ksh 13,700
Required: Prepare a three column cash book and balance it off.
Date posted:
May 7, 2019
.
Answers (1)
-
The following balances were extracted from the books of Rehema
Traders on 1st January 2015.
Ksh
Capital...
(Solved)
The following balances were extracted from the books of Rehema
Traders on 1st January 2015.
Ksh
Capital 600,000
Creditors 180,000
Motor van 200,000
Furniture 200,000
Stock 60,000
Debtors 80,000
Cash 240,000
The following transactions took place during the year ended 31st December
2015:
(i) Sold furniture worth Ksh 60,000 for which Ksh 40,000 cash was received and the
balance was due at the end of the year.
(ii) Purchased goods worth Ksh 100,000 for which cash of Ksh 70,000 was paid and
the balance was still outstanding at the end of the year.
(iii) Cash Ksh 10,000 was taken from the business by the proprietor to settle the
spouse's hospital bill.
Required: Outline the effect of each transaction on the items of the balance
sheet.
Date posted:
May 7, 2019
.
Answers (1)
-
On 1st January 2015, Ndovu Traders had Ksh 30,000 in cash and
Ksh 75,000 at the bank.
During the month, the following transactions took place:
January 2: Bought...
(Solved)
On 1st January 2015, Ndovu Traders had Ksh 30,000 in cash and
Ksh 75,000 at the bank.
During the month, the following transactions took place:
January 2: Bought goods in cash worth Ksh 15,500.
5: Received cash from Chui Ksh 23,750 after allowing 5% cash
discount.
8: Withdrew Ksh 8,900 from the bank for personal use.
11: Maro, a debtor settled her account of Ksh 16,800 by a cheque of Ksh
16,000.
15: Sales amounted to Ksh 24,250 in cash.
17: Paid Furaha traders Ksh 29,100 in cash in full settlement of their
account less
3% cash discount.
20: Withdrew Ksh 15,000 from the bank for business use.
22: Koko a debtor settled her account of Ksh 40,000 by cheque less 2.5%
cash discount.
25: Paid wages Ksh 21,000 cash
Required: Prepare a duly balanced three column cash book.
Date posted:
May 7, 2019
.
Answers (1)
-
Outline the advantages of using hoarding to promote a product
(Solved)
Outline the advantages of using hoarding to promote a product.
Date posted:
April 25, 2019
.
Answers (1)
-
Discuss five monetary policies that are used by the central bank of Kenya to influence the amount of...
(Solved)
Discuss five monetary policies that are used by the central bank of Kenya to influence the amount of money in circulation in the economy.
Date posted:
April 23, 2019
.
Answers (1)
-
Give reasons as to why the government undertakes the responsibility to provide its public with certain goods
(Solved)
Give reasons as to why the government undertakes the responsibility to provide its public with certain goods.
Date posted:
April 19, 2019
.
Answers (1)
-
Outline four challenges of using free gift as a method of product promotion
(Solved)
Outline four challenges of using free gift as a method of product promotion.
Date posted:
April 18, 2019
.
Answers (1)
-
Outline the importance of ethics in public relations
(Solved)
Outline the importance of ethics in public relations
Date posted:
April 17, 2019
.
Answers (1)
-
What factors account for the presence of small firms in an economy?
(Solved)
What factors account for the presence of small firms in an economy?
Date posted:
April 9, 2019
.
Answers (1)
-
The following information was extracted from books of Chunga Traders for the period ending
31/12/2000:-
Fixed assets – 350,000
Drawings – 50,000
Creditors – 50,000
Cash – 60,000
Discount received 4,000
Rent...
(Solved)
The following information was extracted from books of Chunga Traders for the period ending
31/12/2000:-
Fixed assets – 350,000
Drawings – 50,000
Creditors – 50,000
Cash – 60,000
Discount received 4,000
Rent – 12,000
Bank overdraft – 10,000
Debtors – 20,000
Stock (31/12/2000)-30,000
Commission received – 6,000
Gross profit – 80,000
Electricity – 3,000
Stock (11/1/2000) – 50,000
Salaries – 20,000
Prepare:- Their profit & loss account
Date posted:
April 4, 2019
.
Answers (1)
-
The following balance sheet was prepared by the accounts clerk of Mapato traders:-
Requirements:
Calculate the following
i) Working capital
ii) Return on capital
iii) Current ratio
iv) Capital employed
v) Borrowed...
(Solved)
The following balance sheet was prepared by the accounts clerk of Mapato traders:-
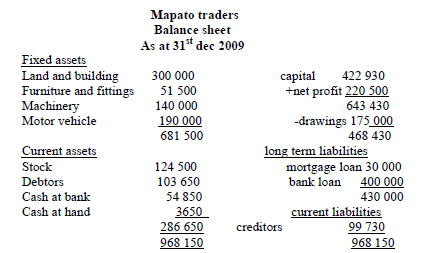
Requirements:
Calculate the following
i) Working capital
ii) Return on capital
iii) Current ratio
iv) Capital employed
v) Borrowed capital
Date posted:
April 4, 2019
.
Answers (1)
-
The following trial balance was extracted from Vumilia traders as 31st December 2006
Additional information:
-closing stock 25,000
-Outstanding salaries 450
-Insurance 900 has been paid in advance
-Depreciate machinery...
(Solved)
The following trial balance was extracted from Vumilia traders as 31st December 2006
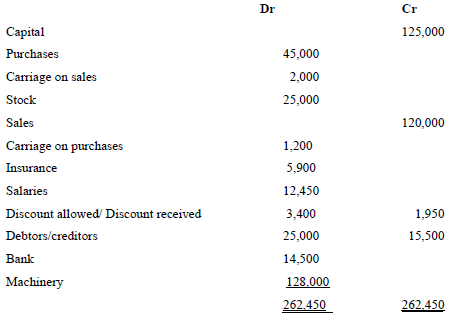
Additional information:
-closing stock 25,000
-Outstanding salaries 450
-Insurance 900 has been paid in advance
-Depreciate machinery by 10% on cost
Required: i) trading, profit and loss a/c
ii) Balance sheet
Date posted:
April 4, 2019
.
Answers (1)
-
The following information was extracted from Jaribu traders on 31st December 2009
Stock turnover 5
Mark up ...
(Solved)
The following information was extracted from Jaribu traders on 31st December 2009
Stock turnover 5
Mark up 25%
Cost of sales 60,000
Closing stock 8,000
Required: i) Net sales
ii) Average stock
iii) Opening stock
iv) Net purchases
Date posted:
April 4, 2019
.
Answers (1)
-
During the month of March 2010 the petty cashier of Nyangija distributors
made the following payment after receiving an imprest of shs12, 000 from the general...
(Solved)
During the month of March 2010 the petty cashier of Nyangija distributors
made the following payment after receiving an imprest of shs12, 000 from the general cashier.
March 3 traveling 3500
March 6 office expenses 1000
March 8 postage 1200
March 15 staff tea 800
March 19 stationery 2000
March 22 office expenses 800
March 24 staff tea 1000
March 26 sundry expenses 700
March 31 F. Benson a creditor 900
Required: Using the analytical columns below prepare a petty cash book of Nyangija distributors
- Traveling
- Office expenses
- Postage
- Stationery
- Staff tea
- Sundry expenses
- Ledger accounts
Date posted:
April 4, 2019
.
Answers (1)
-
The following is a trial balance of JAO traders as at 31/12/2009
...
(Solved)
The following is a trial balance of JAO traders as at 31/12/2009
Dr Cr
(Shs) (Shs)
Capital 170000
Opening stock 60000
Equipment at cost 125000
Purchases 161000
Sales 208000
Discounts 2000 8000
Returns 27000 25000
Salaries 20000
Telephone charges 5000
Water bills 2100
Creditors 15100
Debtors 21000
Electricity expenses 2000
Insurance paid 1000
426000 426000
Additional information
i. Closing stock was valued at Shs.72000
ii.Telephone charges prepaid was Shs.1000 and outstanding water bills was Shs.1300
iii.Depreciation on equipment is 10% p.a on cost
iv.Carriage inwards was Shs.11000 and carriage outwards Shs.10000
Prepare trading and profit loss account for the year ending 31/12/2009
Date posted:
April 4, 2019
.
Answers (1)
-
On 1st June 2009, Nyamira Traders had cash in hand shs.87,000 and cash at bank Shs.250,000.
During the month, the following transactions took place:-
2009 June 2:-Cash...
(Solved)
On 1st June 2009, Nyamira Traders had cash in hand shs.87,000 and cash at bank Shs.250,000.
During the month, the following transactions took place:-
2009 June 2:-Cash sales shs.50,000 issued Receipt No.063
3:- Paid salaries and wages shs.101,500 by cheque ; cheque no. 083
6:- Received a cheque for shs.76,800 from Kemunto, after allowing her a cash discount
of 4% issued a receipt No. 064
12:- Settled Omwabo’s account of shs.40,000 in cash, having deducted shs.800 cash
discount. Received recipt no. 0656
18:- Withdrew shs.30,000 from bank for office use
21:- Received shs.16,500 cash from Manwari in settlement of his account less shs.660
cash discount. Receipt No. 065
22: - Bought office furniture by cheque shs.85,000. Receipt No. 734
23:- Paid wages Shs.24,000 in cash receipt No. 801
28:- Withdrew shs.5000 cash for private use
30:- Received a cheque for shs.150,000 in respect of cash sales . Receipt No. 066
Required: Prepare:- (i) A cash receipts journal
(ii) A cash payment journal
Date posted:
April 4, 2019
.
Answers (1)
-
Journalize the following transactions which took place in the business of W. Wanjala during
the month of June 2009:-
June 1 Balance B/f...
(Solved)
Journalize the following transactions which took place in the business of W. Wanjala during
the month of June 2009:-
June 1 Balance B/f from May 2009 were:-
Office furniture shs.50,000 and motor vehicle shs.100,000
June 2 Purchased office furniture on credit for shs.65,000 from Mwema furniture
June 10 Sold an old vehicle on credit to Omwami garage for shs.200,000
June 25. Discovered that a motor vehicle that had been bought on credit from
Kanyere motor for Kshs.750,000, had been recorded in purchases account
June 28 Sold an old computer to classic academy on credit for ksh. 15,000
June 29 : Sold an old tractor whose book value is Kshs. 200,000 for Khs.250,000
to Goseta
Date posted:
April 4, 2019
.
Answers (1)
-
A petty cashier of Mugirango traders operates his petty cash book on an imprest system
of sh. 2500. On I February 2009, he had cash in...
(Solved)
A petty cashier of Mugirango traders operates his petty cash book on an imprest system
of sh. 2500. On I February 2009, he had cash in hand of Sh. 500 and was reimbursed the
difference by the main cashier to restore his cash float. The following transactions took
place during the same month of February 2009:
Feb 2nd paid taxi fare sh.150 and wages sh250
4th Bought five reams of paper for sh25 each and stamps for sh.30
7th Paid wages sh.250 and bought envelopes for sh.40
20th Bought tea for staff sh.70 and paid for water bills sh.56
28th Paid for electricity sh.80 and stamps sh.40
Required: Prepare a petty cash book using the following analysis columns;
- Wages
- Traveling
- Stationery
- Postage
- Miscellaneous
Date posted:
April 4, 2019
.
Answers (1)