-
A group of young men decided to raise Ksh.480000 to start a business. Before actual payment was made four members pulled out and each of...
(Solved)
A group of young men decided to raise Ksh.480000 to start a business. Before actual payment was made four members pulled out and each of the remaining had to pay an additional Ksh.20000. Write an expression in terms of P for.
(a) (i) Original contribution of each member.
(ii) Contribution after withdrawal of four members.
(b) Form an equation in P and hence determine the number of initial members.
(c) Three men Kamau, James and Hassan shared Shs.480000 such that Kamau: James is 3: 2 and James: Hassan is 4: 2. Find how much each got.
Date posted:
May 23, 2019
.
Answers (1)
-
The table alongside shows the rates of taxation in a certain year.
In that year Mr. Kariuki a civil servant was earning a basic salary of...
(Solved)
The table alongside shows the rates of taxation in a certain year.

In that year Mr. Kariuki a civil servant was earning a basic salary of Ksh. 27 000 per month. In
addition he was entitled to other taxable allowances totalling to Ksh 11 000 per month and a
personal relief of Ksh 1056 per month. He lives in a government house where he is paying a
nominal rent of Ksh. 3 500 per month.
(a) Calculate how much income tax Mr. Kariuki pays per month (in sh)
(b) Mr. Kariuki’s other deductions per month were co-operative society contribution of sh 2500
and loan repayment of sh. 3000, calculate his net salary per month.
Date posted:
May 23, 2019
.
Answers (1)
-
The figure below shows a triangle inscribed in a circle. AB = 6cm, BC = 9cm and AC =
10cm.
(a) The interior angles of triangle ABC.
(b)...
(Solved)
The figure below shows a triangle inscribed in a circle. AB = 6cm, BC = 9cm and AC =
10cm.
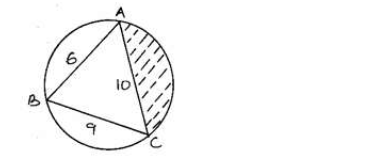
Calculate
(a) The interior angles of triangle ABC.
(b) The radius of the circle.
(c) The area of the shaded part.
Date posted:
May 23, 2019
.
Answers (1)
-
An arc subtends an angle of 0.9 radians. If radius of circle is 13cm, find the length of the arc.
(Solved)
An arc subtends an angle of 0.9 radians. If radius of circle is 13cm, find the length of the arc.
Date posted:
May 23, 2019
.
Answers (1)
-
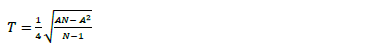
Make N the subject of the formula.
(Solved)
Make N the subject of the formula.
Date posted:
May 23, 2019
.
Answers (1)
-
In the figure below CB is a tangent to the circle, DEB is a straight line DE:EB=1:3
(Solved)
In the figure below CB is a tangent to the circle, DEB is a straight line DE:EB=1:3
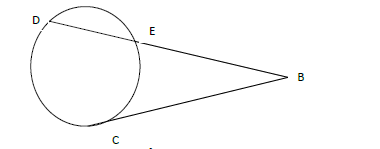
Find BD and EB given that CB=8√3cm
Date posted:
May 23, 2019
.
Answers (1)
-
An item that costs sh 24000 cash can be bought on hire purchase. A customer pays sh 6000
as deposit and then makes 6 monthly instalments...
(Solved)
An item that costs sh 24000 cash can be bought on hire purchase. A customer pays sh 6000
as deposit and then makes 6 monthly instalments of sh 3500 each. Calculate the monthly rate
of compound interest, giving your answer to 1 d.p.
Date posted:
May 22, 2019
.
Answers (1)
-
Machine A can complete a piece of work in 6 hours while machine B can complete the same
work in 10 hours. If both machines start...
(Solved)
Machine A can complete a piece of work in 6 hours while machine B can complete the same
work in 10 hours. If both machines start working together and machine B breaks down after
two hours, how long will it take machine A to complete the rest of the work.
Date posted:
May 22, 2019
.
Answers (1)
-
The first term of an arithmetic sequence is (2x+1) and the common difference is (x+1) if the
product of the first and the second terms is...
(Solved)
The first term of an arithmetic sequence is (2x+1) and the common difference is (x+1) if the
product of the first and the second terms is zero, find the first three terms of the two possible
sequences.
Date posted:
May 22, 2019
.
Answers (1)
-
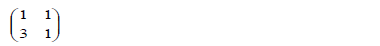
Find the inverse of the matrix.
(Solved)
Find the inverse of the matrix.
Date posted:
May 22, 2019
.
Answers (1)
-
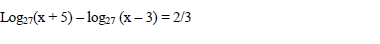
Find the value of x in the expression below
(Solved)
Find the value of x in the expression below
Date posted:
May 22, 2019
.
Answers (1)
-
Mwangi truncated 7/9 to 3 decimal places. Calculate the percentage error resulting from the
truncating.
(Solved)
Mwangi truncated 7/9 to 3 decimal places. Calculate the percentage error resulting from the
truncating.
Date posted:
May 22, 2019
.
Answers (1)
-
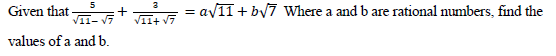
Given the surds below Where a and b are rational numbers, find the values of a and b.
(Solved)
Date posted:
May 22, 2019
.
Answers (1)
-
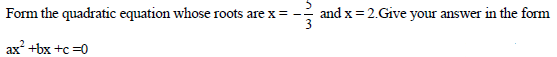
Form the quadratic equation whose roots are give below
(Solved)
Date posted:
May 22, 2019
.
Answers (1)
-
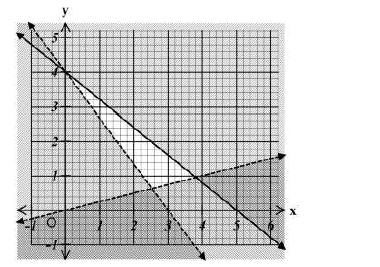
Form the three inequalities that satisfy the unshaded region in the diagram below.
(Solved)
Form the three inequalities that satisfy the unshaded region in the diagram below.
Date posted:
May 22, 2019
.
Answers (1)
-
V is a point on the minor arc SR.
(Solved)
V is a point on the minor arc SR.
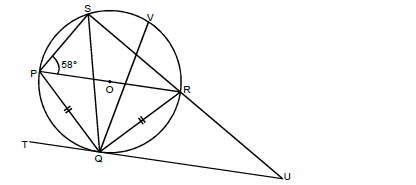
(a) Calculate the size of the following angles giving reasons for your answer.
(i) Angle QPS
(ii) Reflex Angle QOS
(iii)Angle QVS
(iv)Angle QVR
(b) Given that SR = 5cm and RV = 4cm find UQ.
Date posted:
May 10, 2019
.
Answers (1)
-
The diagram below shows a right pyramid on square base ABCD and vertex V. O is the centre of the base AB = 14cm.
VA =...
(Solved)
The diagram below shows a right pyramid on square base ABCD and vertex V. O is the centre of the base AB = 14cm.
VA = 20cm and N is the midpoint of BC
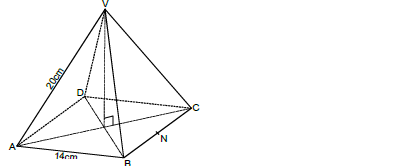
Find
(a) the height of the pyramid
(b) the length VN
(c) the angle between
(i) BV and the plane ABCD
(ii) VO and the plane BVC
(d) Calculate the volume of the pyramid.
Date posted:
May 10, 2019
.
Answers (1)
-
A number is selected from 2, 5, 7, 9, 11, 13 and pared with another number selected from 4, 6, 8, 10, 12, 14.
(Solved)
A number is selected from 2, 5, 7, 9, 11, 13 and pared with another number selected from 4, 6, 8, 10, 12, 14.
(a) Construct a table sharing how the numbers are paired.
(b) Find the probability that the sum of the selected numbers is even.
(c) Find the probability that the sum is a prime number and also add.
(d) Find the probability that the sum is greater than 15.
Date posted:
May 10, 2019
.
Answers (1)
-
The table below shows income tax rates.
(Solved)
The table below shows income tax rates.
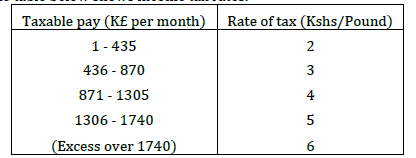
A company employee earns a monthly salary Kshs 32,000 and is also given a taxable house allowance amounting to
Kshs 1784 per month.
(a) Calculating his total income tax in K£ per month.
(b) The employee is entitled to a personal relief of Kshs 1700 per month determine his tax.
(c) If the employee is entitled to a personal relief of Kshs 1700 per month determine his tax.
Date posted:
May 10, 2019
.
Answers (1)
-
The pth term of a sequence is given by 2p + 3
(Solved)
The pth term of a sequence is given by 2p + 3
(a) Write down the first five terms of the sequence.
(b) Find S50 , the sum of the first fifty terms of the sequence.
(c) Show that sum of the first P terms of the sequence is given by Sp = p² + 4p.
Hence or otherwise find the largest integral value of P such that Sp < 725
Date posted:
May 10, 2019
.
Answers (1)