-
State two factors that must be kept constant for a gas to obey Boyle’s law.
(Solved)
State two factors that must be kept constant for a gas to obey Boyle’s law.
Date posted:
May 30, 2019
.
Answers (1)
-
The figure below shows two connected bodies of masses 0.5kg and 50g joined by a light inextensible string passing over a smooth pulley. When released,...
(Solved)
The figure below shows two connected bodies of masses 0.5kg and 50g joined by a light inextensible string passing over a smooth pulley. When released, the 0.5kg mass moves a distance of 0.6m before coming to rest. The coefficient of friction between the 50g mass and the table is 0.3.
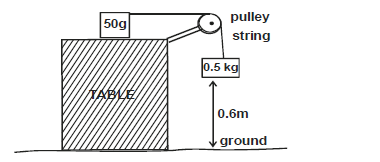
i) Determine :
I. the tension on the string.
II. the acceleration of the 0.5kg mass.
ii) Find the velocity of the 0.5kg mass just before hitting the ground.
Date posted:
May 30, 2019
.
Answers (1)
-
On a certain planet a simple pendulum of length 0.5m oscillates with a frequency of 1.25Hz. If the mass of the body
suspended on the body...
(Solved)
On a certain planet a simple pendulum of length 0.5m oscillates with a frequency of 1.25Hz. If the mass of the body
suspended on the body is 50g.
Determine :
i) the acceleration of gravity on the planet.
ii) the weight of the body on the planet.
Date posted:
May 30, 2019
.
Answers (1)
-
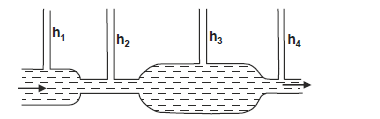
The figure below shows a tube of varying cross-sectional area fitted with narrow tubes of uniform cross-sectional areas h1, h2,
h3 and h4 represent the heights...
(Solved)
The figure below shows a tube of varying cross-sectional area fitted with narrow tubes of uniform cross-sectional areas h1, h2,
h3 and h4 represent the heights of water column as the water flows in the tube at varied speeds. Arrange the heights h1, h2, h3
and h4 in increasing order starting with the lowest.
Date posted:
May 30, 2019
.
Answers (1)
-
The figure below shows a log of wood 2m long lying on a flat ground. Two forces F1 and F2 applied at the ends of...
(Solved)
The figure below shows a log of wood 2m long lying on a flat ground. Two forces F1 and F2 applied at the ends of the log will
just lift the log while maintaining horizontal position.
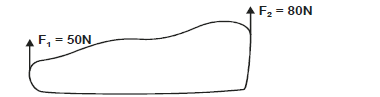
Determine :
a) the weight of the log.
b) the perpendicular distance from the centre of gravity of the log to force F2
Date posted:
May 30, 2019
.
Answers (1)
-
State one similarity between “moment of force about a point” and “work done”
(Solved)
State one similarity between “moment of force about a point” and “work done”
Date posted:
May 30, 2019
.
Answers (1)
-
The figure below shows two balloons containing two different gases suspended on a rod. The set up is in equilibrium.
When the set up is moved...
(Solved)
The figure below shows two balloons containing two different gases suspended on a rod. The set up is in equilibrium.
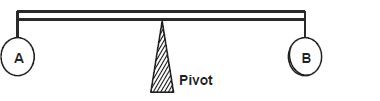
When the set up is moved in hot sun the system tips to the right.
a) Compare expansivity of the gases A and B.
b) Explain your answer to (a) above.
Date posted:
May 30, 2019
.
Answers (1)
-
Explain why gases have larger intermolecular distances than solids.
(Solved)
Explain why gases have larger intermolecular distances than solids.
Date posted:
May 30, 2019
.
Answers (1)
-
The figure shows a U-tube connected to gas supply containing liquids L1 and L2 of densities 1.8gcm-3 and 0.8gcm-3 respectively in equilibrium.
Given that h1 =...
(Solved)
The figure shows a U-tube connected to gas supply containing liquids L1 and L2 of densities 1.8gcm-3 and 0.8gcm-3 respectively in equilibrium.
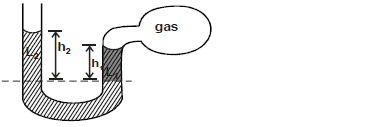
Given that h1 = 8cm, h2 = 10cm and atmospheric pressure is 1.02 x 10⁵Pa. Determine the gas pressure.
Date posted:
May 30, 2019
.
Answers (1)
-
Give a reason why mercury is preferred for use in a thermometer.
(Solved)
Give a reason why mercury is preferred for use in a thermometer.
Date posted:
May 30, 2019
.
Answers (1)
-
The figure below shows a glass tube dipped in water inside a trough. The cross sectional area of the tube is 2cm2.
Determine the adhesive...
(Solved)
The figure below shows a glass tube dipped in water inside a trough. The cross sectional area of the tube is 2cm2.
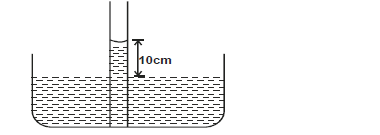
Determine the adhesive force between water and glass. (Take density of water = 1000kgm-3, acceleration due to gravity =
10ms-2).
Date posted:
May 30, 2019
.
Answers (1)
-
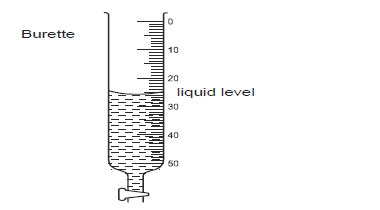
The figure below shows a burette containing a liquid up to the level marked on the figure. 20 drops of the liquid are now run...
(Solved)
The figure below shows a burette containing a liquid up to the level marked on the figure. 20 drops of the liquid are now run out of the burette. If each drop has a volume of 1.1ml. Mark on the figure the new level of the liquid in the burette.
Date posted:
May 30, 2019
.
Answers (1)
-
A generator produces 0.1MW which is transmitted through a cable of resistance 10 ohms. If the potential difference produced is 5KV, calculate current transmitted.
(Solved)
A generator produces 0.1MW which is transmitted through a cable of resistance 10 ohms. If the potential
difference produced is 5KV, calculate current transmitted.
Date posted:
May 29, 2019
.
Answers (1)
-
Define the term ‘kilowatt hour’
(Solved)
Define the term ‘kilowatt hour’
Date posted:
May 29, 2019
.
Answers (1)
-
convex lens forms an image four times the size of the object on a screen. If the distance between the object and the
screen is...
(Solved)
A convex lens forms an image four times the size of the object on a screen. If the distance between the object and the
screen is 10cm.
Determine :
i) the image distance.
ii) focal length of the lens.
Date posted:
May 29, 2019
.
Answers (1)
-
A radio station is transmitting at a frequency of 15MHz. Calculate the wavelength of the transmission.
(Solved)
A radio station is transmitting at a frequency of 15MHz. Calculate the wavelength of the transmission.
Date posted:
May 29, 2019
.
Answers (1)
-
In a transformer, a voltage of 240V is to be stepped down to 24V. The primary current is found to be 1.5A while thesecondary current...
(Solved)
In a transformer, a voltage of 240V is to be stepped down to 24V. The primary current is found to be 1.5A while the
secondary current is 14A. Calculate :
i) Power input
ii) Power output
iii) Power wasted
iv) Efficiency of the transformer
Date posted:
May 29, 2019
.
Answers (1)
-
What is meant by the term “A.C rectification”.
(Solved)
What is meant by the term “A.C rectification”.
Date posted:
May 29, 2019
.
Answers (1)
-
In the nuclear equation below, find a and b
(Solved)
In the nuclear equation below, find a and b

Date posted:
May 29, 2019
.
Answers (1)
-
The figure below shows a Geiger Muller (GM) tube.
i) Name the part labelled A and B
ii) State one reason why halogen gas is used...
(Solved)
The figure below shows a Geiger Muller (GM) tube.
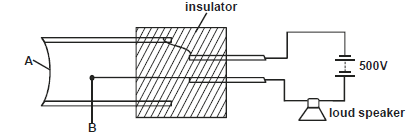
i) Name the part labelled A and B
ii) State one reason why halogen gas is used in the GM tube.
Date posted:
May 29, 2019
.
Answers (1)