-
A photo sensitive cathode of work function 2.1 eV is illustrated with a radiation of wavelength 4.5× 10⁻⁷. Determine the stopping potential for the cathode....
(Solved)
A photo sensitive cathode of work function 2.1 eV is illustrated with a radiation of wavelength 4.5× 10⁻⁷. Determine the stopping potential for the cathode. Speed of light C = 3.0 × 10⁸m/s,1 eV = 1.6 × 10⁻¹⁹j,
h = 6.6 × 10⁻³⁴Js.
Date posted:
May 31, 2019
.
Answers (1)
-
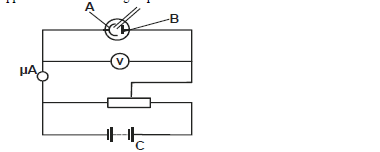
The figure shows an apparatus used to investigate photoelectric effect.
i) Name the parts A and B.
ii) State the function of C.
(Solved)
The figure shows an apparatus used to investigate photoelectric effect.
i) Name the parts A and B.
ii) State the function of C.
Date posted:
May 31, 2019
.
Answers (1)
-
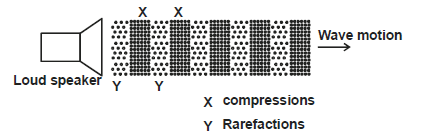
The figure shows a loudspeaker producing sound waves in air.
i) Explain how compression and rarefactions are formed.
iii) The wavelength of the waves produced is...
(Solved)
The figure shows a loudspeaker producing sound waves in air.
i) Explain how compression and rarefactions are formed.
iii) The wavelength of the waves produced is 0.4m. Determine the frequency of the waves if the speed of sound in air is 330m/s.
Date posted:
May 31, 2019
.
Answers (1)
-
A radio transmitter produces waves of frequency 1.5×10⁸Hz. Determine the wavelength of the signal (C = 3.0 × 10⁸m/s).
(Solved)
A radio transmitter produces waves of frequency 1.5×10⁸Hz. Determine the wavelength of the signal (C = 3.0 × 10⁸m/s).
Date posted:
May 31, 2019
.
Answers (1)
-
The figure below shows a graph of values of reciprocal of frequency and corresponding values of wavelength for waves transmitted in a certain medium.
i) Using...
(Solved)
The figure below shows a graph of values of reciprocal of frequency and corresponding values of wavelength for waves transmitted in a certain medium.
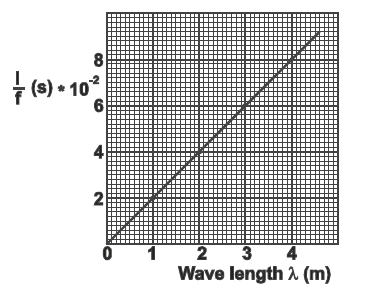
i) Using the wave equation, give the equation of the graph.
ii) Use the graph to determine the velocity of the waves.
Date posted:
May 31, 2019
.
Answers (1)
-
The figure below shows a coil connected to a sensitive galvanometer.
When the magnet is suddenly moved towards the coil in the direction shown, the galvanometer...
(Solved)
The figure below shows a coil connected to a sensitive galvanometer.
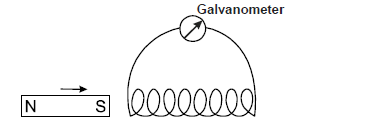
When the magnet is suddenly moved towards the coil in the direction shown, the galvanometer shows a deflection.Explain.
Date posted:
May 31, 2019
.
Answers (1)
-
Name an electromagnetic radiation with highest energy photons.
(Solved)
Name an electromagnetic radiation with highest energy photons.
Date posted:
May 31, 2019
.
Answers (1)
-
An electric heater is rated 1kW, 240V. If the element is connected to 240V mains supply for 10 minutes, determine the amount of heat dissipated.
(Solved)
An electric heater is rated 1kW, 240V. If the element is connected to 240V mains supply for 10 minutes, determine the amount of heat dissipated.
Date posted:
May 31, 2019
.
Answers (1)
-
The figure below shows a circuit diagram. The emf of the cell is 1.5V. When the switch is closed, the voltmeter reads 1.3V and the
ammeter...
(Solved)
The figure below shows a circuit diagram. The emf of the cell is 1.5V. When the switch is closed, the voltmeter reads 1.3V and the
ammeter reads 0.8A.
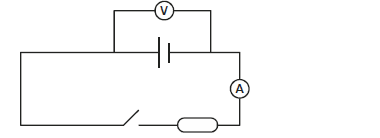
Determine the internal resistance of the cell.
Date posted:
May 31, 2019
.
Answers (1)
-
The figure shows a ray of light travelling through a vacuum enters liquid X at an angle of 50°, travels through and emerges in
glass.
Determine angle...
(Solved)
The figure shows a ray of light travelling through a vacuum enters liquid X at an angle of 50°, travels through and emerges in
glass.
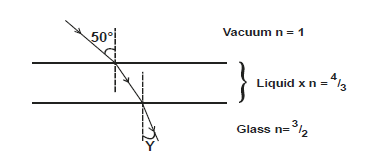
Determine angle Y.
Date posted:
May 31, 2019
.
Answers (1)
-
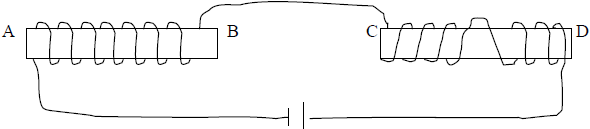
Identify the magnetic poles A, B, C and D in the diagram below.
(Solved)
Identify the magnetic poles A, B, C and D in the diagram below.
Date posted:
May 31, 2019
.
Answers (1)
-
A person claps his hands at approximately 0.5s intervals in front of a wall 90m away. He notices that each echo produced by the wall...
(Solved)
A person claps his hands at approximately 0.5s intervals in front of a wall 90m away. He notices that each echo produced by the wall coincides with the next clap.
i) Calculate the approximate speed of sound
ii) If the results obtained above were used as a basis for an experimental method to determine the speed of sound, what procedure should be adopted to obtain high accuracy in the timing part of the experiment?
Date posted:
May 31, 2019
.
Answers (1)
-
Give one property of sound waves
(Solved)
Give one property of sound waves
Date posted:
May 31, 2019
.
Answers (1)
-
The figure below shows a ray of light incident on a plane mirror.The mirror is rotated through 10° clockwise about point O in an axis...
(Solved)
The figure below shows a ray of light incident on a plane mirror.
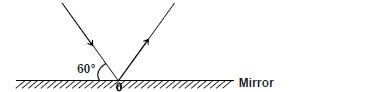
The mirror is rotated through 10° clockwise about point O in an axis perpendicular to plane mirror. Determine the angle between the incident ray and the new reflected ray.
Date posted:
May 31, 2019
.
Answers (1)
-
Define power of a lens and give its units
(Solved)
Define power of a lens and give its units
Date posted:
May 31, 2019
.
Answers (1)
-
Suppose that an object is attached to a spring balance on the Earth's surface and Earth's speed of rotation is gradually increased. What effect, if...
(Solved)
Suppose that an object is attached to a spring balance on the Earth's surface and Earth's speed of rotation is gradually increased. What effect, if any, will this have on.
i) the gravitational attraction between the object and the Earth.
ii) the reading of the spring balance.
Date posted:
May 31, 2019
.
Answers (1)
-
Describe the changes that can be observed during discharging process of a lead –acid accumulator
(Solved)
Describe the changes that can be observed during discharging process of a lead –acid accumulator
Date posted:
May 31, 2019
.
Answers (1)
-
An object put on a beam balance gives the same reading no matter where it is on the Earth's surface, but if it is on...
(Solved)
An object put on a beam balance gives the same reading no matter where it is on the Earth's surface, but if it is on a very
sensitive spring balance, the reading varies from place to place. Explain why this is so.
Date posted:
May 31, 2019
.
Answers (1)
-
Give a reason why the driver of the car has to move through the same bend at a lower speed during a rainy day.
(Solved)
Give a reason why the driver of the car has to move through the same bend at a lower speed during a rainy day.
Date posted:
May 31, 2019
.
Answers (1)
-
The figure shows a defective beam balance with unequal arms. The beam balances with no masses in the pans X and Y.
i)Suggest why this could...
(Solved)
The figure shows a defective beam balance with unequal arms. The beam balances with no masses in the pans X and Y.
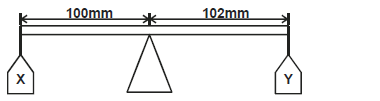
i)Suggest why this could be possible.
ii) If a mass of 300g is placed in pan Y, Calculate the mass which must be placed in pan X to restore the balance.
Date posted:
May 31, 2019
.
Answers (1)