-
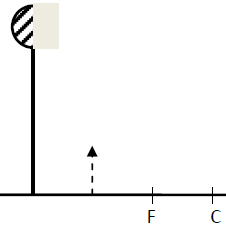
The diagram below shows the image formed by a convex mirror. Complete the diagram to show the position of the object.
(Solved)
The diagram below shows the image formed by a convex mirror. Complete the diagram to show the position of the object.
Date posted:
May 31, 2019
.
Answers (1)
-
A body of mass 5kg is attached to the end of a string of length 50cm and whirled continuously in a horizontal circle. If the...
(Solved)
A body of mass 5kg is attached to the end of a string of length 50cm and whirled continuously in a horizontal circle. If the tension in the string is 81N determine the angular velocity of the body
Date posted:
May 31, 2019
.
Answers (1)
-
A pulley system having a velocity ratio of 4 is used to raise a load of 80N through a height of 0.6m at a constant...
(Solved)
A pulley system having a velocity ratio of 4 is used to raise a load of 80N through a height of 0.6m at a constant speed using an effort of 20N in a time of 15 seconds. Calculate the power developed by the effort
Date posted:
May 31, 2019
.
Answers (1)
-
A spring with a spring constant of 68N/M stretches by 0.22m when a force is applied on it. Determine the energy stored in the stretched...
(Solved)
A spring with a spring constant of 68N/M stretches by 0.22m when a force is applied on it. Determine the energy stored in the stretched spring.
Date posted:
May 31, 2019
.
Answers (1)
-
A bullet of mass 20g travelling at 400m/s is strapped by a concrete wall. calculate the amount of energy transferred to the wall
(Solved)
A bullet of mass 20g travelling at 400m/s is strapped by a concrete wall. calculate the amount of energy transferred to the wall
Date posted:
May 31, 2019
.
Answers (1)
-
Name a device that is used to convert sound energy to electrical energy
(Solved)
Name a device that is used to convert sound energy to electrical energy
Date posted:
May 31, 2019
.
Answers (1)
-
Distinguish between velocity ratio and mechanical advantage
(Solved)
Distinguish between velocity ratio and mechanical advantage
Date posted:
May 31, 2019
.
Answers (1)
-
A body weighs 40N in air, 30N in water and 35N when in liquid X. Find the relative density of liquid X
(Solved)
A body weighs 40N in air, 30N in water and 35N when in liquid X. Find the relative density of liquid X
Date posted:
May 31, 2019
.
Answers (1)
-
A constant mass of hydrogen gas occupies a volume of 4.0cm3 at a pressure of 2.4x10⁵ Pa and temperature of 288k. Find its volume at...
(Solved)
A constant mass of hydrogen gas occupies a volume of 4.0cm3 at a pressure of 2.4x10⁵ Pa and temperature of 288k. Find its volume at a pressure of 1.6x10⁵Pa when the temperature is 293K
Date posted:
May 31, 2019
.
Answers (1)
-
Two liquids of density 1100kg/m3 and 850kg/m3 are mixed in equal volumes. The mixture fills a tank of 300cmx 40cm x 50cm to the bring...
(Solved)
Two liquids of density 1100kg/m3 and 850kg/m3 are mixed in equal volumes. The mixture fills a tank of 300cmx 40cm x 50cm to the bring calculate the mass of each liquid
Date posted:
May 31, 2019
.
Answers (1)
-
A vessel weighs 90g and has a specific heat capacity of 420J/Kg/K. Calculate its heat capacity
(Solved)
A vessel weighs 90g and has a specific heat capacity of 420J/Kg/K. Calculate its heat capacity
Date posted:
May 31, 2019
.
Answers (1)
-
A crane just lifts 9940N when an effort of 116N is applied. Find its velocity ratio if the crane has an efficiency of 72%
(Solved)
A crane just lifts 9940N when an effort of 116N is applied. Find its velocity ratio if the crane has an efficiency of 72%
Date posted:
May 31, 2019
.
Answers (1)
-
An oil drop forms a circular patch of area 5x10⁻³m2. If the oil drop has a volume of 9x10-12M2, calculate the thickness of the oil...
(Solved)
An oil drop forms a circular patch of area 5x10⁻³m2. If the oil drop has a volume of 9x10-12M2, calculate the thickness of the oil molecule.
Date posted:
May 31, 2019
.
Answers (1)
-
A concave mirror of focal length 20 cm forms a real image three times the size of the object. If the object height is 4cm;determine,...
(Solved)
A concave mirror of focal length 20 cm forms a real image three times the size of the object. If the object height is 4cm;
determine, using graphical method, the:
i) object distance
ii) The image distance
Date posted:
May 31, 2019
.
Answers (1)
-
A Power station has an input of 30kw at a potential difference of 5kv.A transformer with a secondary coil of 1000 turns is used to...
(Solved)
A Power station has an input of 30kw at a potential difference of 5kv.A transformer with a secondary coil of 1000 turns is used to step down the voltage to 1000v for transmission along a grid .Assuming there are no power loses in the transformer .calculate.
i) current in the primary coil
ii) The number of turns in the primary coil
iii) The current in the secondary coil
iv) State which of the coils is thick and why
Date posted:
May 31, 2019
.
Answers (1)
-
The graph below shows the relationship between the voltage drop across a certain capacitor and the charge stored in the capacitor.
From the graph calculate the...
(Solved)
The graph below shows the relationship between the voltage drop across a certain capacitor and the charge stored in the capacitor.
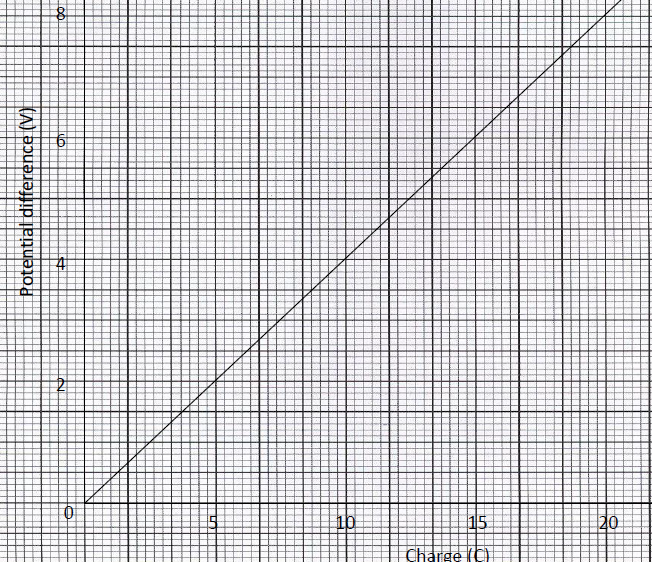
From the graph calculate the capacitance of the capacitor.
Date posted:
May 31, 2019
.
Answers (1)
-
The diagram below shows a circuit containing three capacitors.
i) Write an expression for effective capacitance between X and Y.
ii) If c1=6µF, c2=4.5µF and c3=5 µF,...
(Solved)
The diagram below shows a circuit containing three capacitors.
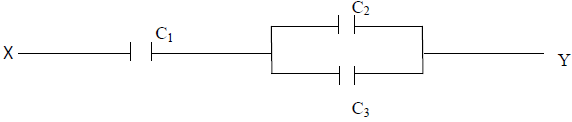
i) Write an expression for effective capacitance between X and Y.
ii) If c1=6μF, c2=4.5μF and c3=5 μF, calculate the charge stored when point XY is connected in series with a battery of 6V
Date posted:
May 31, 2019
.
Answers (1)
-
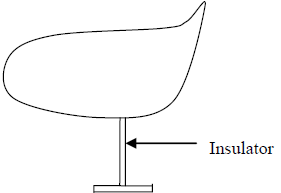
Show the charge distribution on the hollow conductor shown below if it is positively charged.
(Solved)
Show the charge distribution on the hollow conductor shown below if it is positively charged.
Date posted:
May 31, 2019
.
Answers (1)
-
A charge of 4.8C flows through a lamp every second. Calculate the number of electrons involved per second.
(Solved)
A charge of 4.8C flows through a lamp every second. Calculate the number of electrons involved per second.
Date posted:
May 31, 2019
.
Answers (1)
-
The figure below shows a ray of light incident on a water-air interface from a source 8m deep.
i) Ray A is observed to bend as...
(Solved)
The figure below shows a ray of light incident on a water-air interface from a source 8m deep.
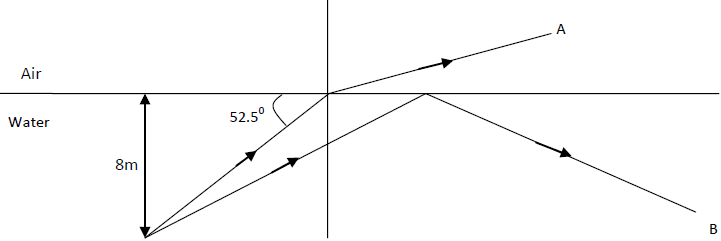
i) Ray A is observed to bend as it enters the air. Give a reason why this occurs
ii) If the refractive index of water is 1.35, calculate the angle of refraction of ray A
iii) Find the critical angle of water
iv) Give a reason why ray B is not travelling out of water
v) A fish is placed at the source of light ray. Calculate the maximum area of view on the surface of water
Date posted:
May 31, 2019
.
Answers (1)