-
A student designed a transformer to provide power to an electric bell marked 24W, 6V from a 240V mains. He wound 50 turns and N...
(Solved)
A student designed a transformer to provide power to an electric bell marked 24W, 6V from a 240V mains. He wound 50 turns and N turns on an iron ring. When he a connected the coil of 50 turns to the bell and the N turns coil to an a.c, he found that the transformer was only 60% efficient. Find:
(i) The value of N
(ii) The power in the coil with N turns
Date posted:
June 3, 2019
.
Answers (1)
-
The figure below shows a set up by a student.
State and explain what happens to the sound from the buzzer as the bottle and its...
(Solved)
The figure below shows a set up by a student.
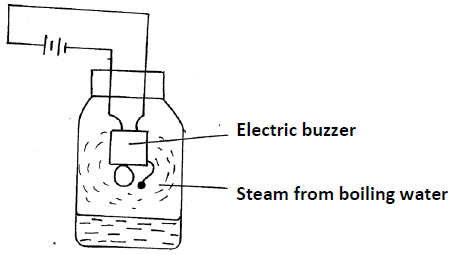
State and explain what happens to the sound from the buzzer as the bottle and its contents are cooled to 0oC
Date posted:
June 3, 2019
.
Answers (1)
-
A bullet of mass 20g moving at 400 m/s strikes a block of wood of mass 3.5kg initially at rest. The bullet sticks into the...
(Solved)
A bullet of mass 20g moving at 400 m/s strikes a block of wood of mass 3.5kg initially at rest. The bullet sticks into the block and the two move off together on a horizontal surface, where a frictional retarting force of 4N is acting between the block and surface.
(i) Determine the initial common velocity of bullet and wooden block.
(ii) What distance does the block move before coming to rest?
Date posted:
June 3, 2019
.
Answers (1)
-
A striker kicks a ball of mass 250g initially at rest with a force of 75N. if the foot was in contact with the ball...
(Solved)
A striker kicks a ball of mass 250g initially at rest with a force of 75N. if the foot was in contact with the ball for 0.10sec. Calculate the take off velocity of the ball.
Date posted:
June 3, 2019
.
Answers (1)
-
A test tube of mass 10g and uniform cross-sectional area 4cm2 is partly filled with lead shots and floats vertically in water with 5cm of...
(Solved)
A test tube of mass 10g and uniform cross-sectional area 4cm2 is partly filled with lead shots and floats vertically in water with 5cm of its length submerged.
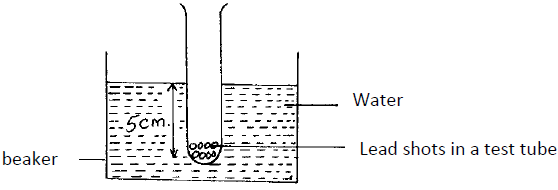
Find the:-
(i) Mass of the lead shots.
(ii) Length of the test tube that would be submerged in a liquid of density 0.75g/cm3.
Date posted:
June 3, 2019
.
Answers (1)
-
The effort piston of a hydraulic machine is of radius 2.8 cm, while that of the load piston is of radius 14cm. The machine raises...
(Solved)
The effort piston of a hydraulic machine is of radius 2.8 cm, while that of the load piston is of radius 14cm. The machine raises a load of 120 kg at a constant velocity through 2.5m. If the machine has an efficiency of 80%, find:-
(i) the velocity ratio of the hydraulic machine.
(ii) The mechanical advantage of the hydraulic machine.
(iii) The effort needed to raise the load.
Date posted:
June 3, 2019
.
Answers (1)
-
A spherical ball bearing of mass 0.0024 kg is held between the anvil and spindle of a micrometer screw gauge. The reading on the gauge...
(Solved)
A spherical ball bearing of mass 0.0024 kg is held between the anvil and spindle of a micrometer screw gauge. The reading on the gauge when the jaws are closed without anything in between is 0.11mm. Use this information and the position of the scale in the figure below to answer the questions (a) and (b) below:
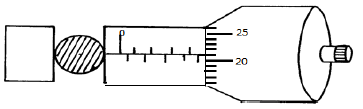
a) What is the diameter of the ball bearing?
b) Find the density of the ball bearing correct to 3 significant figures
Date posted:
June 3, 2019
.
Answers (1)
-
A transformer is used on a 240V a.c supply to deliver 12A at 120V to a heating coil. If 20% energy is lost at the...
(Solved)
A transformer is used on a 240V a.c supply to deliver 12A at 120V to a heating coil. If 20% energy is lost at the transformer, calculate the current in the primary coil.
Date posted:
June 3, 2019
.
Answers (1)
-
Figure below shows sound waves emitted by a drum struck.
Explain why the wave fronts are directed towards the ground.
(Solved)
Figure below shows sound waves emitted by a drum struck.
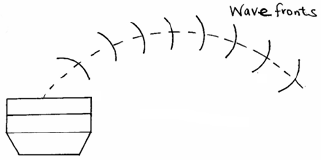
Explain why the wave fronts are directed towards the ground.
Date posted:
June 3, 2019
.
Answers (1)
-
A student set up a mass attached to a spring such that when it oscillates, it taps on water surface in a wide shallow tank.
The...
(Solved)
A student set up a mass attached to a spring such that when it oscillates, it taps on water surface in a wide shallow tank.
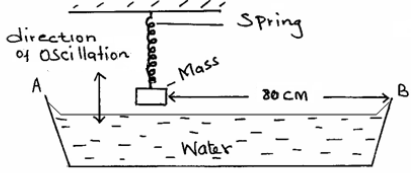
The student measured time for 20 oscillations and found that the mass takes 36 seconds. Given that the student counted four rippies between the mass and end B of the tank. Determine the speed of the waves.
Date posted:
June 3, 2019
.
Answers (1)
-
The figure below shows an electroscope being charged by induction.
(i) State the reason why the cap of the electroscope is made circular.
(ii) On the...
(Solved)
The figure below shows an electroscope being charged by induction.
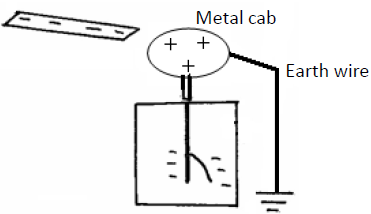
(i) State the reason why the cap of the electroscope is made circular.
(ii) On the same diagram, show the direction of the flow of electrons on the earth wire.
Date posted:
June 3, 2019
.
Answers (1)
-
The figure below shows rectangular block of height 4cm floating vertically in a beaker containing two
immiscible liquid A and B. The densities of the liquid...
(Solved)
The figure below shows rectangular block of height 4cm floating vertically in a beaker containing two
immiscible liquid A and B. The densities of the liquid are 8000 kg/m³ and 12,000kg/m³ respectively.
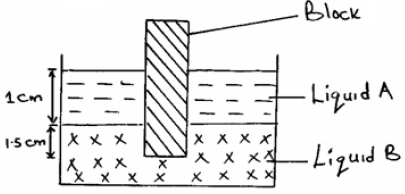
The cross sectional area is 2cm².
Determine.
(i) the weight of the liquid A displaced by the black.
(ii) the weight of the liquid B displaced by the block.
(iii) the mass of the block.
(iv) the density of the block.
Date posted:
June 3, 2019
.
Answers (1)
-
A man uses the inclined plane to lift a 50kg load through a vertical line height of 4.0m. The inclined plane makes an angle of...
(Solved)
A man uses the inclined plane to lift a 50kg load through a vertical line height of 4.0m. The inclined plane makes an angle of 300 with the horizontal. If the efficiency of the inclined plane is 80%, determine.
(a) The effort needed to move the load up the inclined plane at a constant velocity.
(b) The work done against friction in raising the load through the height of 4.0m. (Take g = 10N/kg).
Date posted:
June 3, 2019
.
Answers (1)
-
A minibus of mass 1600kg travelling at a constant velocity of 20mls collides with a stationary car of mass 800kg. The impact takes 2 seconds...
(Solved)
A minibus of mass 1600kg travelling at a constant velocity of 20mls collides with a stationary car of mass 800kg. The impact takes 2 seconds before the two moves together and come to rest after 15 seconds. Determine.
(a) The common velocity.
(b) The distance moved after the impact.
(c) The impulse force.
Date posted:
June 3, 2019
.
Answers (1)
-
The moon goes round the earth at a constant speed. Explain why it is true to say the moon is accelerating.
(Solved)
The moon goes round the earth at a constant speed. Explain why it is true to say the moon is accelerating.
Date posted:
June 3, 2019
.
Answers (1)
-
A block of metal of mass 150g at 1000C is dropped into a lagged calorimeter of heat capacity 40Jk-1 containing 100g of water at 250C....
(Solved)
A block of metal of mass 150g at 1000C is dropped into a lagged calorimeter of heat capacity 40Jk-1 containing 100g of water at 250C. The temperature of the resulting mixture is 340C. (Specific heat capacity of water = 4200Jkgˉ¹).
Determine;
(i) Heat gained by calorimeter.
(ii) Heat gained by water.
(iii) Heat lost by the metal block.
(iv) Specific heat capacity of the metal block.
Date posted:
June 3, 2019
.
Answers (1)
-
State the difference between the temperature measured in Kelvin scale and Celsius scale.
(Solved)
State the difference between the temperature measured in Kelvin scale and Celsius scale.
Date posted:
June 3, 2019
.
Answers (1)
-
A steel cylinder of capacity 0.5m³ contains nitrogen at a pressure of 30,000Pa when the temperature is 270C. What will be the pressure of nitrogen...
(Solved)
A steel cylinder of capacity 0.5m³ contains nitrogen at a pressure of 30,000Pa when the temperature is 270C. What will be the pressure of nitrogen if it is allowed to flow into another cylinder of capacity 9.5m³ with the temperature reduced to -230C?
Date posted:
June 3, 2019
.
Answers (1)
-
The figure below shows a set-up that may be used to verify pressure law.
(i) State the measurements that should be taken in the experiment.
(ii) Explain...
(Solved)
The figure below shows a set-up that may be used to verify pressure law.
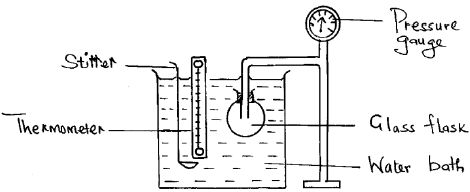
(i) State the measurements that should be taken in the experiment.
(ii) Explain how the measurements in (i) above may be used to verify pressure law.
Date posted:
June 3, 2019
.
Answers (1)
-
A uniform metre rule pivoted at it’s 15.0cm mark is balanced by a 2N weight suspended at the 5.0cm mark. Determine the mass of the...
(Solved)
A uniform metre rule pivoted at it’s 15.0cm mark is balanced by a 2N weight suspended at the 5.0cm mark. Determine the mass of the metre rule.
Date posted:
June 3, 2019
.
Answers (1)