-
Outline four disadvantages of using publicity as a method of product promotion.
(Solved)
Outline four disadvantages of using publicity as a method of product promotion.
Date posted:
August 20, 2019
.
Answers (1)
-
John insured his building worth shs.2,000,000 against fire for shs1,500,000. The building was gutted down by accidental fire and the remains were valued at shs...
(Solved)
John insured his building worth shs.2,000,000 against fire for shs1,500,000. The building was gutted down by accidental fire and the remains were valued at shs 600,000. Calculate the amount of compensation.
Date posted:
August 19, 2019
.
Answers (1)
-
Highlight four problems associated with the use of sign language as a means of communication.
(Solved)
Highlight four problems associated with the use of sign language as a means of communication.
Date posted:
August 19, 2019
.
Answers (1)
-
Name the type of business organization described by each of the following: a) Form by an Act of Parliament b) Ownership is between 7 and infinitec)...
(Solved)
Name the type of business organization described by each of the following:
a) Form by an Act of Parliament
b) Ownership is between 7 and infinite
c) Managed by a committee
d) Any owner can act on behalf of the others
Date posted:
August 19, 2019
.
Answers (1)
-
Simba traders bought 200 blankets at shs.500 each on credit. The term of sale were 20% trade discount and 5% cash discount, if payment is...
(Solved)
Simba traders bought 200 blankets at shs.500 each on credit. The term of sale were 20% trade discount and 5% cash discount, if payment is made within 2 weeks. Calculate the amount paid if payment was made within one week.
Date posted:
August 19, 2019
.
Answers (1)
-
You have been contacted to write a business plan for Junior Achievement Expo. Highlight four components of your plan.
(Solved)
You have been contacted to write a business plan for Junior Achievement Expo. Highlight four components of your plan.
Date posted:
August 19, 2019
.
Answers (1)
-
The following trial balance was extracted from the books of Amos traders as at 31.12.2017.
(Solved)
The following trial balance was extracted from the books of Amos traders as at 31.12.2017.
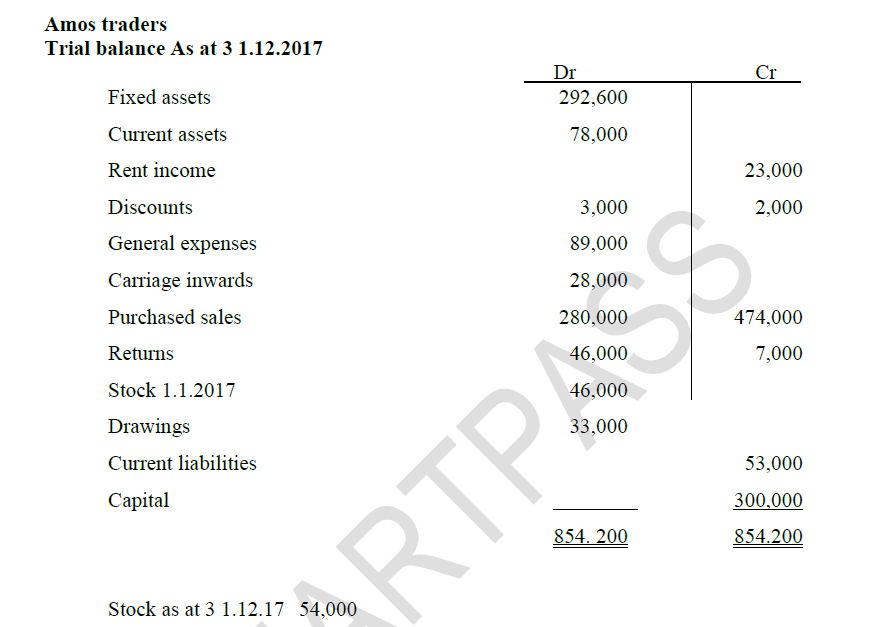
(i) Prepare Trading profit and loss account for the year ending 31.12.2017
(ii) Calculate rate of return on capital.
(iii) Rate of stock turnover.
Date posted:
August 19, 2019
.
Answers (1)
-
Describe the possible consequences of a government legislation of fixing the price of a commodity below the equilibrium price.
(Solved)
Describe the possible consequences of a government legislation of fixing the price of a commodity below the equilibrium price.
Date posted:
August 19, 2019
.
Answers (1)
-
On Jan. 1st 2017, Precious traders had shs. 130,000 cash in hand and bank credit balance of sh.134, 000. During the month the following transactions took...
(Solved)
On Jan. 1st 2017, Precious traders had shs. 130,000 cash in hand and bank credit balance of sh.134, 000. During the month the following transactions took place;
Jan. 2nd Cash sales of shs.215,000
Jan. 5th Debtor settled his account of sh, 800,000 by cheque less 5% cash discount
Jan. 15th Paid salaries sh. 40,000 in cash
Jan 20th Settled a creditors account of sh. 80,000 by cheque less 2% cash discount.
Jan. 21st . Received a cheque for sh. 84,600 from Kilelu traders after deducting 6%
cash discount
Jan 24th . Deposited sh. 100,000 into bank from office cash 200,000..
Jan 25th Cash sales banked directly
Jan 26th A cheque received on January 5 from a debtor was dishonoured.
Jan 27th . Purchased goods worth sh. 20,000 on credit
Jan 31st . Banked all the cash except sh. 50,000
Prepare:- A three column cash book duly balanced
Date posted:
August 19, 2019
.
Answers (1)
-
State four factors that may limit the exploitation of natural resources in a country.
(Solved)
State four factors that may limit the exploitation of natural resources in a country.
Date posted:
August 19, 2019
.
Answers (1)
-
Draw four channels of distribution for imported sugar.
(Solved)
Draw four channels of distribution for imported sugar.
Date posted:
August 19, 2019
.
Answers (1)
-
The following account balances were obtained from the books of Simba Traders on 30th April 2018.
(Solved)
The following account balances were obtained from the books of Simba Traders on 30th April 2018.
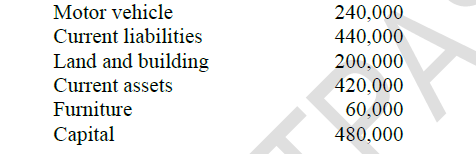
Prepare a trial balance for Simba traders as at 30th April 2018.
Date posted:
August 19, 2019
.
Answers (1)
-
Highlight four advantages of using television as an advertising media.
(Solved)
Highlight four advantages of using television as an advertising media.
Date posted:
August 19, 2019
.
Answers (1)
-
Kenyans are facing serious economic crisis due to inflation. State four measures that can be taken by the government to control it.
(Solved)
Kenyans are facing serious economic crisis due to inflation. State four measures that can be taken by the government to control it.
Date posted:
August 19, 2019
.
Answers (1)
-
Lopoi Enterprises acquired a building valued at sh. 1,000,000 on 1st Jan 2017. The building was insured with two insurance companies’ pana and Amaco for...
(Solved)
Lopoi Enterprises acquired a building valued at sh. 1,000,000 on 1st Jan 2017. The building was insured with two insurance companies’ pana and Amaco for shs. 600,000 and 400,000 respectively. In May 2017, fire damaged the building causing Elephant enterprises to suffer a loss of 20% of the building value.
Determine contribution made by Amaco and pana.
Date posted:
August 19, 2019
.
Answers (1)
-
The information below relates to Midcity retail business.
(Solved)
The information below relates to Midcity retail business.
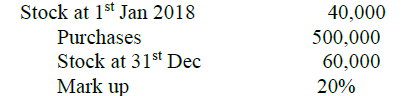
Prepare a trading account for Midcity retail business for the year ended 31st Dec. 2018.
Date posted:
August 19, 2019
.
Answers (1)
-
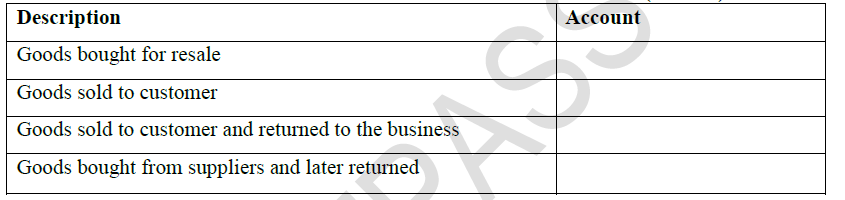
Identify the accounts in which the following transactions would be recorded in the ledger.
(Solved)
Identify the accounts in which the following transactions would be recorded in the ledger.
Date posted:
August 19, 2019
.
Answers (1)
-
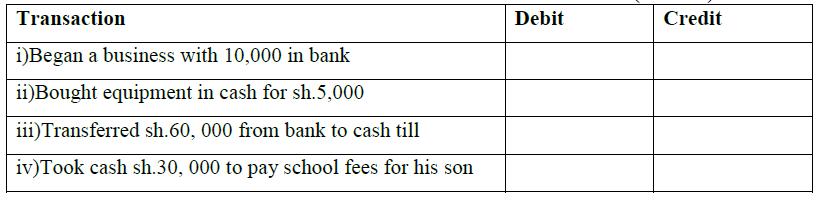
From the transactions below state the accounts to be debited and to be credited.
(Solved)
From the transactions below state the accounts to be debited and to be credited.
Date posted:
August 19, 2019
.
Answers (1)
-
The following information relates to Njao Traders for the year ended 31 .12.2018.
(Solved)
The following information relates to Njao Traders for the year ended 31 .12.2018.
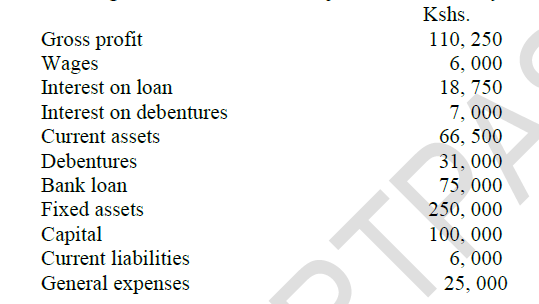
Prepare his profit and loss account for the year ended 31.12.2018
Date posted:
August 19, 2019
.
Answers (1)
-
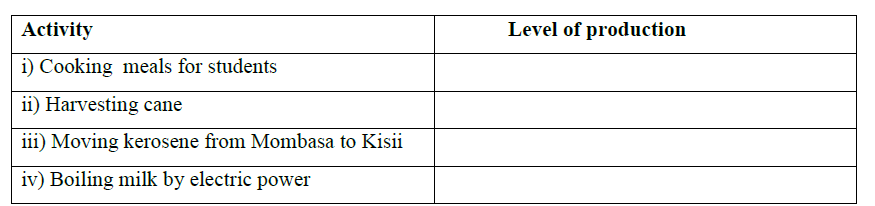
State the level of production for each of the following activities
(Solved)
State the level of production for each of the following activities
Date posted:
August 19, 2019
.
Answers (1)