-
A man spent a ninth of his salary on food and quarter of the remainder on electricity and water bills. He paid fees with 20%...
(Solved)
A man spent a  of his salary on food and
  of the remainder on electricity and water bills. He paid fees with 20% of his salary and invested 16% of what was left into a business. After taking a game drive on which he spent Ksh 2000, he saved Ksh 5350.
Calculate:
(a) His total monthly earnings.
(b) How much he spent on fees.
(c) How much he invested.
(d) The percentage of the salary saved.
Date posted:
August 27, 2019
.
Answers (1)
-
Three consecutive terms in a G.P are 32x+1 , 9x and 81 respectively.
a. Calculate the value of x
b. Find the common ratio of the...
(Solved)
Three consecutive terms in a G.P are 32x+1 , 9x and 81 respectively.
a. Calculate the value of x
b. Find the common ratio of the series.
c. Calculate the sum of the first 10 terms of the series.
d. Given that the 5th and 7th terms of the G.P in (a) above form the 1st two consecutive terms of an A.P Calculate the sum of the 1st 20 terms of the A.P.
Date posted:
August 27, 2019
.
Answers (1)
-
In a group of 40 people, 10 are healthy and every person of the remaining 30 has either high blood pressure, a high level of...
(Solved)
In a group of 40 people, 10 are healthy and every person of the remaining 30 has either high blood pressure, a high level of cholesterol or both. 15 have high blood pressure and 25 have high level of cholesterol. If a person is selected at random from this group, what is the probability that he/she
a. Has high blood pressure only
b. Has high level of cholesterol only
c.. Has high blood pressure and high level of cholesterol
d. Has either high blood pressure or high level of cholesterol
Date posted:
August 27, 2019
.
Answers (1)
-
The following table shows individual rates of income tax
Income K£ PA ...
(Solved)
The following table shows individual rates of income tax
Income K£ PA Rate (sh. Per K£)
1 – 4512 2
4513 - 9024 3
9025 – 13536 4
13537 – above 5
Mr. Kariuki lives in a company house for which he pays a nominal rent of Ksh.610 per month. For taxation purpose, his basic salary is increased by 15%. He is insured and pays sh.1200 as premiums per month and claims insurance relief of K£ 36 per annum. He also claims a family relief of sh.660 per month. In addition, he is a member of a co-operative society, to which he remits Ksh.1500 per month, as shares. If Mr. Kariuki’s P.A.Y.E is ksh.2400 per month, calculate his net salary in shillings per month.
Date posted:
August 27, 2019
.
Answers (1)
-
A straight line L1 has its x-intercept and y-intercept as -6 and 4 respectively.
a) Write its equation in the form ax +by +c =0 where...
(Solved)
A straight line L1 has its x-intercept and y-intercept as -6 and 4 respectively.
a) Write its equation in the form ax +by +c =0 where a, b, and c are integers
b) Another line L2 which is parallel to L1 in (a) above passes through (2,3k) and (-k,8). Find the value of k.
c) Find the equation of the perpendicular bisector to the line L1
d) Calculate the angle which L1 makes with the x-axis
Date posted:
August 27, 2019
.
Answers (1)
-
XAY is a tangent to the circle ABCD. AD is parallel to the straight line CBY . Angle ADC = 114°, and AB = BY
Calculate...
(Solved)
XAY is a tangent to the circle ABCD. AD is parallel to the straight line CBY . Angle ADC = 114°, and AB = BY
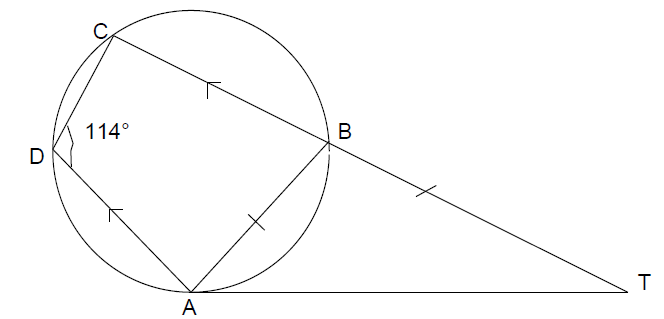
Calculate angles
i. ABC
ii. BCA
Date posted:
August 27, 2019
.
Answers (1)
-
Find the equation of the normal to the curve y = x3 – 2x2 + 3x – 1
(Solved)
Find the equation of the normal to the curve y = x3 – 2x2 + 3x – 1
Date posted:
August 27, 2019
.
Answers (1)
-
The figure below shows a circle centre O touching the vertices A , B , C of triangle AB = 8.8cm , BC = 5.4cm...
(Solved)
The figure below shows a circle centre O touching the vertices A , B , C of triangle AB = 8.8cm , BC = 5.4cm and AC = 9.2cm.
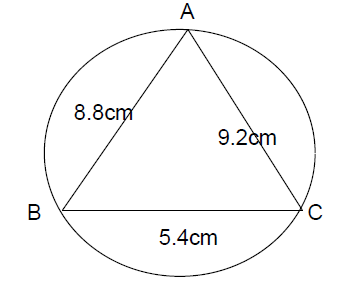
Calculate the radius of the circle to the nearest whole number.
Date posted:
August 27, 2019
.
Answers (1)
-
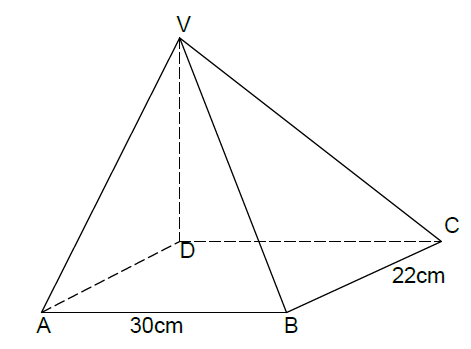
The figure below represents a right pyramid with a vertex V and a rectangular base, ABCD. VA = VB = VC = VD = 40...
(Solved)
The figure below represents a right pyramid with a vertex V and a rectangular base, ABCD. VA = VB = VC = VD = 40 cm.AB = 30cm and BC = 22cm. X is the mid-point of BC.Calculate the size of the angle between planes VBC and ABCD
Date posted:
August 27, 2019
.
Answers (1)
-
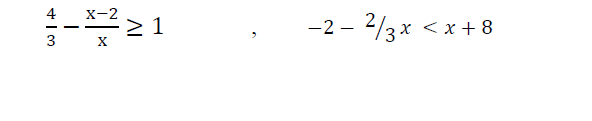
Solve and represent the integral values of the linear inequalities given below on a number line.
(Solved)
Solve and represent the integral values of the linear inequalities given below on a number line.
Date posted:
August 27, 2019
.
Answers (1)
-
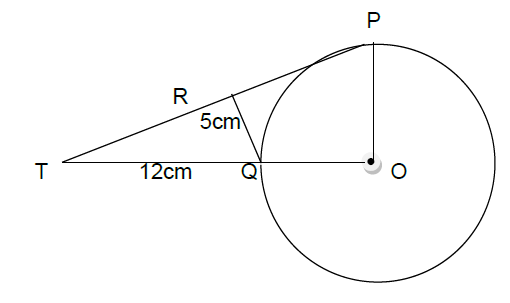
In the figure below, RP and RQ are tangents to the circle centre O, radius r cm. OQ produced meets PR produced at T. QT...
(Solved)
In the figure below, RP and RQ are tangents to the circle centre O, radius r cm. OQ produced meets PR produced at T. QT = 12cm and QR = 5cm Calculate the radius of the circle.
Date posted:
August 27, 2019
.
Answers (1)
-
The density of a sphere of diameter p cm is 2.68 g/cm3 and that of another sphere is diameter Q cm is 14.23 g/cm3. Determine...
(Solved)
The density of a sphere of diameter p cm is 2.68 g/cm3 and that of another sphere is diameter Q cm is 14.23 g/cm3. Determine the volume of sphere Q that would have the same mass as 80cm3.
Date posted:
August 27, 2019
.
Answers (1)
-
Find the exact area of the region bounded by the curve y = 9x - x3 and the x axis.
(Solved)
Find the exact area of the region bounded by the curve y = 9x - x3 and the x axis.
Date posted:
August 27, 2019
.
Answers (1)
-
Given that y is inversely proportional to xn and ß is the constant of proportionality and that x = 2, when y = 12, and...
(Solved)
Given that y is inversely proportional to xn and β is the constant of proportionality and that x = 2, when y = 12, and x = 4, when y = 3, find the values of n and β.
Date posted:
August 27, 2019
.
Answers (1)
-
a)Find the position vector OC of the centre of a circle C, whose equation is 2x2 + 2y2 + 4x - 6y - 26 =...
(Solved)
a)Find the position vector OC of the centre of a circle C, whose equation is 2x2 + 2y2 + 4x - 6y - 26 = 0.
b. If the circle passes through P (3, 2), use vector method to find the diameter of the circle.
Date posted:
August 27, 2019
.
Answers (1)
-
Find the scalars S and T such that Sa + Tb = c
(Solved)
The position vectors a =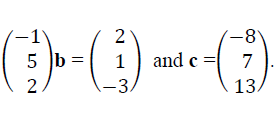 Find the scalars S and T such that Sa + Tb = c
Date posted:
August 27, 2019
.
Answers (1)
-
Find the percentage error in the quotient in 9.16cm ÷2.0cm
(Solved)
Find the percentage error in the quotient in 9.16cm ÷2.0cm
Date posted:
August 27, 2019
.
Answers (1)
-
Make c the subject of the formula in
(Solved)
Make c the subject of the formula in
Date posted:
August 27, 2019
.
Answers (1)
-
Using the tables of squares, square roots and reciprocal,solve the equation below
(Solved)
Using the tables of squares, square roots and reciprocal,solve the equation below
Date posted:
August 27, 2019
.
Answers (1)
-
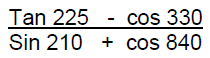
Without using tables or a calculator evaluate
(Solved)
Without using tables or a calculator evaluate
Date posted:
August 27, 2019
.
Answers (1)