-
Nelly drew a square ABCD of sides 5cm accurately. While refilling her pen, a drop of ink (I) landed inside the square ABCD.Given that IA...
(Solved)
Nelly drew a square ABCD of sides 5cm accurately. While refilling her pen, a drop of ink (I) landed inside the square ABCD.Given that IA < 5cm, IA > IC and the area of triangle DCI > 10cm2. Locate by construction the region I.
Date posted:
August 28, 2019
.
Answers (1)
-
How much water must be added to 36 litres of a liquid containing 65% alcohol to obtain a liquid containing 45% alcohol?
(Solved)
How much water must be added to 36 litres of a liquid containing 65% alcohol to obtain a liquid containing 45% alcohol?
Date posted:
August 28, 2019
.
Answers (1)
-
A poultry farmer in Lelmokwo vaccinated 540 of his 720 chicken against a disease. Two months later 5% of the vaccinated and 80% of the...
(Solved)
A poultry farmer in Lelmokwo vaccinated 540 of his 720 chicken against a disease. Two months later 5% of the vaccinated and 80% of the unvaccinated chicken contracted the disease. Calculate the probability that the chicken chosen at random contracted the disease.
Date posted:
August 28, 2019
.
Answers (1)
-
A solid has a base in the shape of a rhombus whose diagonals AC and BD are 32cm and 24cm respectively. The height CE which...
(Solved)
A solid has a base in the shape of a rhombus whose diagonals AC and BD are 32cm and 24cm respectively. The height CE which is perpendicular to AC, BC and DC is 24cm.
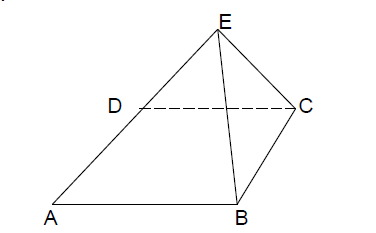
Calculate: the angles between the planes EBD and ABCD.
Date posted:
August 28, 2019
.
Answers (1)
-
Find the co-ordinates of a point at which the gradient of the curve y = x2 – 3x + 3 is seven.
(Solved)
Find the co-ordinates of a point at which the gradient of the curve y = x2 – 3x + 3 is seven.
Date posted:
August 28, 2019
.
Answers (1)
-
If a = -i + 3j, b = i + 6j and c = 5i + 12j. Show that the points are collinear.
(Solved)
If a = -i + 3j, b = i + 6j and c = 5i + 12j. Show that the points are collinear.
Date posted:
August 28, 2019
.
Answers (1)
-
Mr. Bett wants to buy a flat screen TV set on hire purchase. The cash price is sh. 28,000. He can pay the cash Price...
(Solved)
Mr. Bett wants to buy a flat screen TV set on hire purchase. The cash price is sh. 28,000. He can pay the cash Price or make a down payment of sh. 8,000 and 15 monthly installments of sh. 2000 each. Calculate the rate of interest charged per month.
Date posted:
August 28, 2019
.
Answers (1)
-
Find all the integral values of x which satisfy the inequalities 3(3 – x) < 5x – 9 < 2x + 8
(Solved)
Find all the integral values of x which satisfy the inequalities 3(3 – x) < 5x – 9 < 2x + 8
Date posted:
August 28, 2019
.
Answers (1)
-
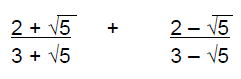
Work out the following:
(Solved)
Work out the following:
Date posted:
August 28, 2019
.
Answers (1)
-
The velocity of a particle, Vm/s, moving in a straight line after t seconds is given by
V = 3t² - 3t – 6
Find:-
(i) The acceleration...
(Solved)
The velocity of a particle, Vm/s, moving in a straight line after t seconds is given by
V = 3t² - 3t – 6
Find:-
(i) The acceleration of the particle after 2 seconds.
(ii) The distance covered by the particle between t = 1 and t = 4 seconds.
(iii) The time when the particle is momentarily at rest.
(iv) The minimum velocity attained by the particle.
Date posted:
August 28, 2019
.
Answers (1)
-
In the figure below, C is a point on AB such that BA = 4BC and D is the mid point of OA OC and...
(Solved)
In the figure below, C is a point on AB such that BA = 4BC and D is the mid point of OA OC and BD intersect at x
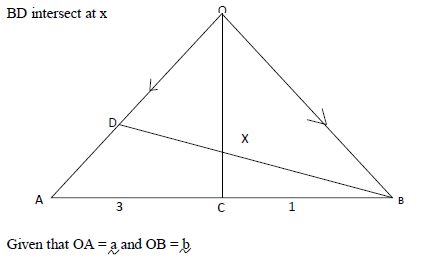
a) Write the vectors below in terms of a and b
i) AB
ii) OC
iii) BD
b) If BX = hBD express ox in terms of a, b and h
c) If OX = kOC, find h and k
d) Hence express OX in terms of a and b only
Date posted:
August 28, 2019
.
Answers (1)
-
The fig shows two intersecting circles with centres A and B and radii 7cm and 10.5cm respectively. The distance between AB = 14 and AM:MB...
(Solved)
The fig shows two intersecting circles with centres A and B and radii 7cm and 10.5cm respectively. The distance between AB = 14 and AM:MB = 3:4.
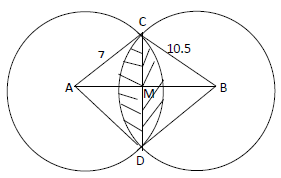
Calculate to four significant fig the;
a) Size of angle CAD
b) Size of angle CBD
c) Area of shaded region (use pi= 3.142)
Date posted:
August 28, 2019
.
Answers (1)
-
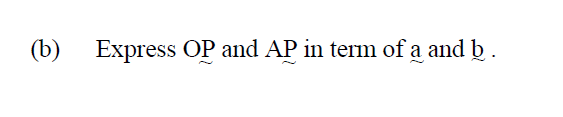
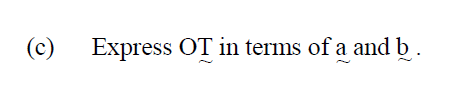
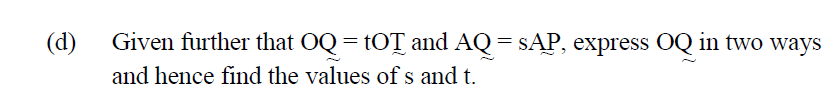
Points P and T divide OB and AB in the ratio 2:3 and 1:3 respectively. Lines OT and AP intersect at Q.
(Solved)

(a) Draw the diagram to represent the above information.
Date posted:
August 28, 2019
.
Answers (1)
-
a) The table below shows measuring cylinder readings Vcm3 of water displaced by x marbles in an experiment.
(Solved)
a) The table below shows measuring cylinder readings Vcm3 of water displaced by x marbles in an experiment.
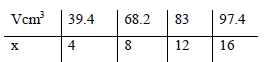
i) On the graph paper provided plot (x, v).
ii) Use the plotted points to draw the line of best fit.
b) Using the line of best fit, determine;
i) The average volume of the ball bearing.
ii) The equation of the line.
c) Using the equation of the line in b(ii) above determine the volume of the water in the cylinder.
Date posted:
August 28, 2019
.
Answers (1)
-
The frequency distribution table below represents the number of kilograms of meat sold in butchery.
(Solved)
The frequency distribution table below represents the number of kilograms of meat sold in butchery.
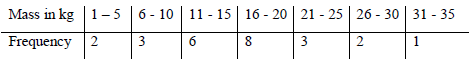
a) State the modal frequency.
b) Calculate the mean mass using assumed mean of 18kg.
c) Calculate the median mass.
Date posted:
August 28, 2019
.
Answers (1)
-
The figure below is a model representing a rocket capsule. The model whose total height is 15cm is
made up of a conical top
(Solved)
The figure below is a model representing a rocket capsule. The model whose total height is 15cm is
made up of a conical top; a hemispherical bottom and the middle part is cylindrical. The radius of the
base of the cone and that of the hemisphere are each 3cm. The height of the cylindrical part is 8cm.
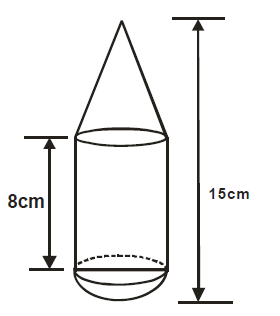
a) Calculate the external surface area of the model.
b) The actual rocket has a total height of 6 metres. The outside of the actual rocket capsule is to be
painted. Calculate the amount of paint required if an area of 20m2 requires 0.75 litres of the paint.
Date posted:
August 28, 2019
.
Answers (1)
-
A jet flies from town Q (60ºS, 24ºE) to town R (60ºS, 10ºW) and then due north for 1200 nautical miles to town S.
(a) Obtain...
(Solved)
A jet flies from town Q (60ºS, 24ºE) to town R (60ºS, 10ºW) and then due north for 1200 nautical miles to town S.
(a) Obtain the latitude of S.
(b) Calculate the distance between Q and R in
(i) Nautical miles.
(ii) km
(c) Find the total flight time if the jet flies at an average speed of 800 knots.
Date posted:
August 28, 2019
.
Answers (1)
-
A trader sold an item at sh7500 after allowing his customer 15% discount on the marked price of the item.
(Solved)
A trader sold an item at sh7500 after allowing his customer 15% discount on the marked price of the item. In so doing he made a profit of 35%.
a) Calculate
i) The marked price of the item
ii) The price at which the trader had bought the item.
b) If the trader had sold the item without giving a discount, calculate the percentage profit he would have made.
c) To clear his stock the trader decided to sell the remaining items at a loss of 10%. Calculate the price at which he sold each item.
Date posted:
August 28, 2019
.
Answers (1)
-
The distance between two towns A and B is 760km. A minibus left town A at 8: 15am and traveled towards B at an average...
(Solved)
The distance between two towns A and B is 760km. A minibus left town A at 8: 15am and traveled towards B at an average speed of 90km/h. A matatu left B at 10:35am and on the same day and travelled towards A at an average speed of 110km/h.
(a) (i) How far from A did they meet?
(ii) At what time did they meet?
(b) A motorist starts from his home at 10:30am on the same day and travelled at an average speed of 100km/h. He arrived at B at the same time as the minibus. Calculate the distance from B to his home.
Date posted:
August 28, 2019
.
Answers (1)
-
The diagram below (not drawn to scale) represents the cross-section of a solid prism to 8.0cm.
(Solved)
The diagram below (not drawn to scale) represents the cross-section of a solid prism to 8.0cm.
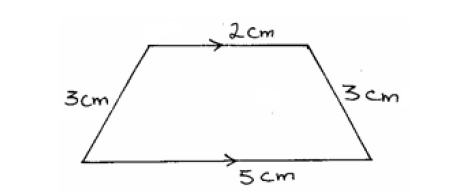
(a) Calculate the volume of the prism.
(b) Given that the density of the prism is 5.75g/cm³, calculate it’s mass in grams.
(c) A second prism is similar to the first one but is made of a different material.
The volume of the second prism is 246.24cm³.
(i) Calculate the area of the cross-section of the second prism.
(ii) Given that the ratio of the mass of the first prism to that of the second is 2: 5, find the density of the second prism.
Date posted:
August 28, 2019
.
Answers (1)