-
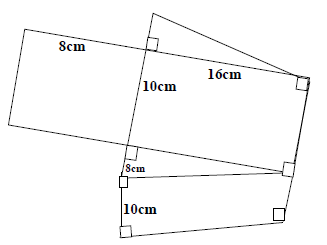
The figure below is a cut out net of a wedge. Find its volume.
(Solved)
The figure below is a cut out net of a wedge. Find its volume.
Date posted:
September 2, 2019
.
Answers (1)
-
Two beakers of exactly similar shape can hold 250ml and 200ml of liquid respectively. If the surface area of the larger beaker is 400cm2, calculate...
(Solved)
Two beakers of exactly similar shape can hold 250ml and 200ml of liquid respectively. If the surface area of the larger beaker is 400cm2, calculate the surface area of the smaller one.
Date posted:
September 2, 2019
.
Answers (1)
-
A straight line passing through the point (-3,4) is perpendicular to the line whose equation is 2y-3x=11 and intersects the x-axis and y-axis at points...
(Solved)
A straight line passing through the point (-3,4) is perpendicular to the line whose equation is 2y-3x=11 and intersects the x-axis and y-axis at points P and Q respectively. Find P.
Date posted:
September 2, 2019
.
Answers (1)
-
A (50°S,20°E) and B(50°S,60°W) are two points on the earth’s surface. Calculate the distance between A and B in kilometer along the great circle. (take...
(Solved)
A (50°S,20°E) and B(50°S,60°W) are two points on the earth’s surface. Calculate the distance between A and B in kilometer along the great circle. (take radius of the earth to be 6370km).
Date posted:
August 30, 2019
.
Answers (1)
-
A contractor employs 40 men to do a piece of work in 60 days each man working 9 hours a day. He is then requested...
(Solved)
A contractor employs 40 men to do a piece of work in 60 days each man working 9 hours a day. He is then requested to do the job in 48days. How many more men working l0 hours a day does he need to employ.
Date posted:
August 30, 2019
.
Answers (1)
-
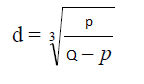
Make P the subject of the formula given.
(Solved)
Make P the subject of the formula given.
Date posted:
August 30, 2019
.
Answers (1)
-
The data below shows marks scored by 8 form four students in Ikutha district mathematics contest 44,32,67. 52, 28, 39, 46, 64.Calculate the mean absolute...
(Solved)
The data below shows marks scored by 8 form four students in Ikutha district mathematics contest 44,32,67. 52, 28, 39, 46, 64.Calculate the mean absolute deviation.
Date posted:
August 30, 2019
.
Answers (1)
-
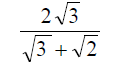
Write in the simplest form using a rational denominator.
(Solved)
Write in the simplest form using a rational denominator.
Date posted:
August 30, 2019
.
Answers (1)
-
The diagram below not drawn to scale shows part of the curve y = x2 + 5 and the line y = 8 – 2x....
(Solved)
The diagram below not drawn to scale shows part of the curve y = x2 + 5 and the line y = 8 – 2x. The line intersects the curve at a point C and D. Lines AC and BD are parallel to the y-axis.
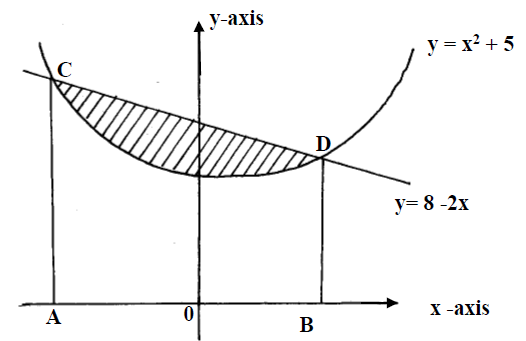
(a) Determine the coordinates of C and D
(b) Use integration to calculate the area bounded by the curve and x – axis between the points C and D.
(c) Calculate the area enclosed by the lines CD, CA, BD and the x-axis.
(d)Hence determine the area of the shaded region.
Date posted:
August 30, 2019
.
Answers (1)
-
A form four class at Kiptulwo secondary school has 15 girls and 25 boys. The probability of a girl completing the secondary school course is...
(Solved)
A form four class at Kiptulwo secondary school has 15 girls and 25 boys. The probability of a girl completing the secondary school course is 3/5 and that of a boy is 4/5.
(a) A student is picked at random from the class. Find the probability that;
(i)The student picked is a girl and will complete the course.
(ii) The student will not complete the course.
(b)Two students are picked at random from the class. Find the probability that;
(i) Both are girls
(ii)Both are of the same gender and will complete the course.
Date posted:
August 30, 2019
.
Answers (1)
-
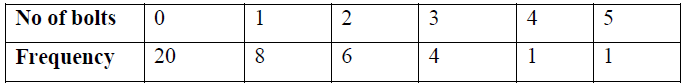
The table below shows the number of defective bolts from a sample of 40.Calculate the standard deviation of the data above.
(Solved)
The table below shows the number of defective bolts from a sample of 40.Calculate the standard deviation of the data above.
Date posted:
August 30, 2019
.
Answers (1)
-
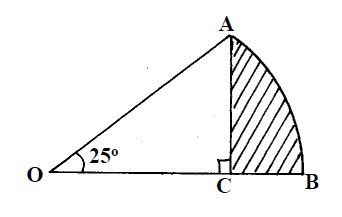
OAB is a sector of a circle centre O and radius 7cm. Arc AB subtends 250 at the center and C is a point on...
(Solved)
OAB is a sector of a circle centre O and radius 7cm. Arc AB subtends 250 at the center and C is a point on OB such that OCA is 900. Calculate the area of the shaded region
Date posted:
August 30, 2019
.
Answers (1)
-
Given that the dimensions of a rectangle are 20.0cm and 25.0cm find the percentage error in calculating the area.
(Solved)
Given that the dimensions of a rectangle are 20.0cm and 25.0cm find the percentage error in calculating the area.
Date posted:
August 30, 2019
.
Answers (1)
-
The base and perpendicular height of a triangle measured to the nearest centimeter are 6cm and 4cm respectively.
(Solved)
The base and perpendicular height of a triangle measured to the nearest centimeter are 6cm and 4cm respectively. Find
(a) The absolute error in calculating the area of the triangle.
(b) The percentage error in the area giving the answer to 1 decimal place.
Date posted:
August 30, 2019
.
Answers (1)
-
In the figure below, O is the centre of the circle. The reflex angle POS =2540 and angle PRT = 520 Calculate
a) Angle QSR
b)...
(Solved)
In the figure below, O is the centre of the circle. The reflex angle POS =2540 and angle PRT = 520 Calculate
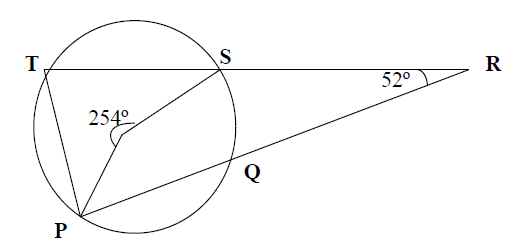
a) Angle QSR
b) Angle QPT
c) Angle QOT, reflex
d) Angle OST
Date posted:
August 30, 2019
.
Answers (1)
-
A map has a scale of 1 : 2500 and on it is square plot of land which has an area of 4cm². Calculate the...
(Solved)
A map has a scale of 1 : 2500 and on it is square plot of land which has an area of 4cm². Calculate the actual area in hectares of the land.
Date posted:
August 29, 2019
.
Answers (1)
-
Solve the equation below.
72x – 8 x 7x + 7 = 0
(Solved)
Solve the equation below.
72x – 8 x 7x + 7 = 0
Date posted:
August 29, 2019
.
Answers (1)
-
The velocity of a particle t seconds after passing a fixed point is given by v = 2t2 – 13t + k where k is...
(Solved)
The velocity of a particle t seconds after passing a fixed point is given by v = 2t2 – 13t + k where k is a constant. The particle has a maximum displacement of 13m from the fixed point when t = ½ seconds.
(a) Calculate the value of k
(b) Find the equation of the displacement of the particle i.e from the fixed point after t seconds
(c) Calculate the distance moved by the particle during the fourth second
Date posted:
August 29, 2019
.
Answers (1)
-
Mr. Karambu is a civil servant in a ministry. He earns a monthly salary of sh.N and allowance of sh.1271.all taxable. He is entitled to...
(Solved)
Mr. Karambu is a civil servant in a ministry. He earns a monthly salary of sh.N and allowance of sh.1271.all taxable. He is entitled to a monthly relief of sh.1056. The table below shows the rates of taxation.
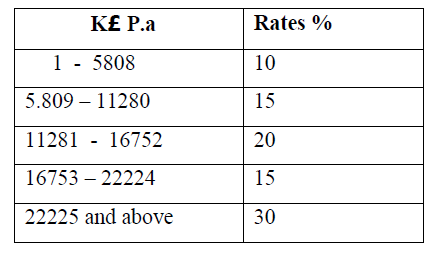
When his salary was increased by 50% the net tax increased by 66.25 % to sh.9036 per month.
(a) What was his net tax in K£ p.a before the salary increase
(b) Calculate his salary before the increase
(c) Calculate the percentage increase in his net pay after the salary increase
Date posted:
August 29, 2019
.
Answers (1)
-
A school’s environmental club consists of 7 boys and 5 girls. Three members are to be randomly chosen to be officials of the club. Use...
(Solved)
A school’s environmental club consists of 7 boys and 5 girls. Three members are to be randomly chosen to be officials of the club. Use a tree diagram to find the probability that:
(a) All the officials are boys
(b) One official is a girl
Date posted:
August 29, 2019
.
Answers (1)