-
The following transactions relate to Mamboleo Retailers for the month of September 2014
Sept 3 Sold goods on credit to Bukachi sh.14000 and Janet sh.18000
Sept 9...
(Solved)
The following transactions relate to Mamboleo Retailers for the month of September 2014
Sept 3 Sold goods on credit to Bukachi sh.14000 and Janet sh.18000
Sept 9 Bought goods on credit from Shaban Traders sh.45000
Sept 14 Bukachi returned goods worth sh.2500
Sept 18 Purchased goods on credit from Nambaka sh.36000 and Janet sh.1200
Sept 22 Goods worth sh.7000 were returned to Shaban Traders and goods worth sh.4000 to Nambaka
Sept 24 Sold goods on credit to Bukachi sh.9000
Sept 26 Goods returned by Nehemiah sh.3000
Sept 30 Bought a generator worth sh.450,000 on credit from Dynomite power company
Required :
Prepare the relevant journals.
Date posted:
September 5, 2019
.
Answers (1)
-
The following balances were extracted from the books of Highway stores on 31st Dec. 2015
(Solved)
The following balances were extracted from the books of Highway stores on 31st Dec. 2015
Items.................................................................... Shs.
Land and buildings ........................................................650,000
Stock...................................................................... 470,000
Bank overdraft.............................................................. 80,000
Debtors...................................................................... 350,000
Ten year loan................................................................ 500,000
Creditors ....................................................................220,000
Cash........................................................................ 50,000
Motor van .....................................................................150,000
Required :
i) Prepare a balance sheet for Highway Stores as at 31st Dec. 2015.
Date posted:
September 5, 2019
.
Answers (1)
-
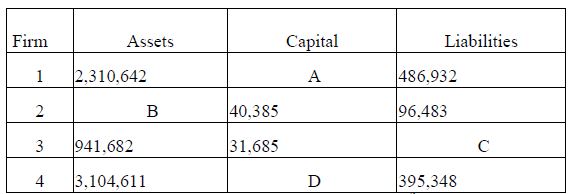
The table below relates to four different businesses, insert the correct values for A, B, C and D.
(Solved)
The table below relates to four different businesses, insert the correct values for A, B, C and D.
Date posted:
September 5, 2019
.
Answers (1)
-
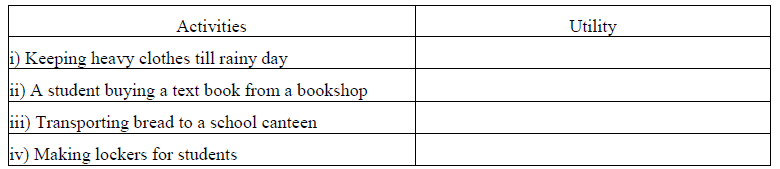
Identify the type of utility created by the following activities.
(Solved)
Identify the type of utility created by the following activities.
Date posted:
September 5, 2019
.
Answers (1)
-
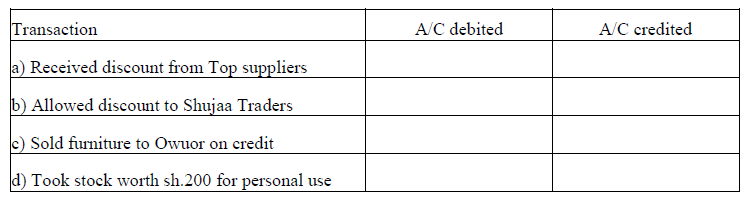
For each of the following transactions indicate the account to be debited or credited.
(Solved)
For each of the following transactions indicate the account to be debited or credited.
Date posted:
September 5, 2019
.
Answers (1)
-
The following table represents the supply of sweet potatoes for three (3) months.Explain FIVE reasons to account for the change in quantity supplied of sweet...
(Solved)
The following table represents the supply of sweet potatoes for three (3) months.
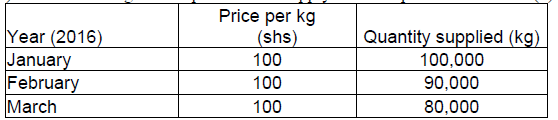
Explain FIVE reasons to account for the change in quantity supplied of sweet potatoes in the market.
Date posted:
September 5, 2019
.
Answers (1)
-
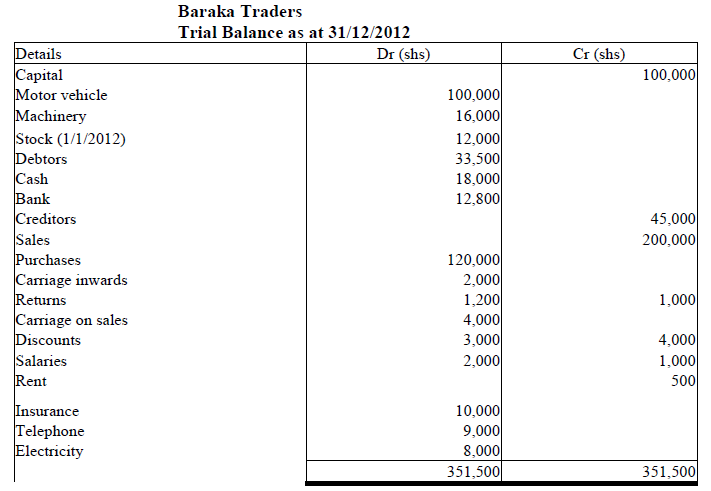
The following information relates to Baraka traders.
Closing stock was valued at sh.8000
Required :
i) The trading profit and loss account.
ii) The balance sheet
(Solved)
The following information relates to Baraka traders.
Closing stock was valued at sh.8000
Required :
i) The trading profit and loss account.
ii) The balance sheet
Date posted:
September 5, 2019
.
Answers (1)
-
The following information relates to Haraka Traders for the year ended
(Solved)
The following information relates to Haraka Traders for the year ended 30th June 2014
Net sales..................................... Shs. 400,000
Expenses .......................................Shs. 30,000
Margin ............................................20%
Rent Revenue ....................................Shs. 20,000
Carriage outwards .................................Shs. 10,000
Prepare Haraka traders profit and loss Account for the year ended 30th June 2014
Date posted:
September 4, 2019
.
Answers (1)
-
Name four acts of parliament enacted to protect consumers.
(Solved)
Name four acts of parliament enacted to protect consumers.
Date posted:
September 4, 2019
.
Answers (1)
-
The table below shows estimated values for a certain country in millions of dollars.
...
(Solved)
The table below shows estimated values for a certain country in millions of dollars.
US$
Wages and salaries .....................450,000
Income from rent .......................30,000
Profit of corporation ..................40,000
Net interest ............................80,000
Indirect taxes ..........................70,000
Subsidies ...............................200,000
Depreciation............................. 80,000
Net income from abroad..................... 50,000
From the above table calculate;
(a) The gross domestic produce
(b) Gross national product
Date posted:
September 4, 2019
.
Answers (1)
-
The following information was extracted from the books of Migori Traders on
(Solved)
The following information was extracted from the books of Migori Traders on 31st December 2015.
Stock 1st Jan................................... 30,000
Sales .......................................................500,000
Purchases ...................................................300,000
Return in ....................................................5,000
Purchases return ............................................20,000
Carriage in ..................................................5,000
Stock 31st Dec 2015............................... 70,000
Sales and wages ..............................................20,000
Commission received........................................... 5,000
Repairs .......................................................5,000
Prepare;
Trading account
Profit and loss account
Date posted:
September 4, 2019
.
Answers (1)
-
Enter the following transactions in a single column cash book and balance it off.
(Solved)
Enter the following transactions in a single column cash book and balance it off.
2013 August 2nd commenced business with Sh. 14.000 cash and 200,000 at the bank.
2013 August 3rd made cash sales amounting to sh. 6,000
2013 August 5th received cash 16,000 from Marwa, a debtor.
2013 August 12th paid for motor expenses Sh. 7,000 in cash.
2013 August 13th drew Sh. 30,000 from bank for office use.
Date posted:
September 4, 2019
.
Answers (1)
-
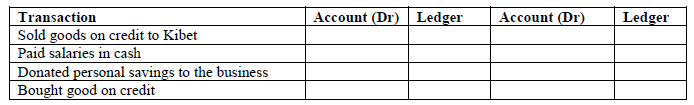
For each of the following transactions, indicate in the spaces provided the accounts to be debited and credited, and the type of ledger in which...
(Solved)
For each of the following transactions, indicate in the spaces provided the accounts to be debited and credited, and the type of ledger in which the accounts is maintained.
Date posted:
September 4, 2019
.
Answers (1)
-
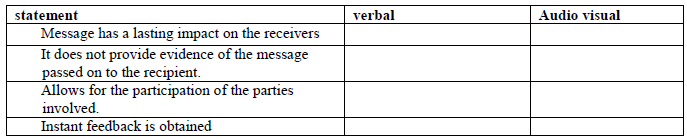
In the spaces provided indicate whether each of the following sentences relate to verbal or audio visual communication.
(Solved)
In the spaces provided indicate whether each of the following sentences relate to verbal or audio visual communication.
Date posted:
September 4, 2019
.
Answers (1)
-
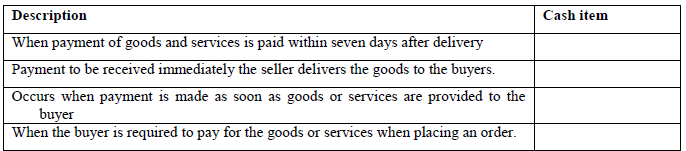
The table below contains descriptions relating to the type of cash terms used in home trade. Name the type which each description refers to.
(Solved)
The table below contains descriptions relating to the type of cash terms used in home trade. Name the type which each description refers to.
Date posted:
September 4, 2019
.
Answers (1)
-
The following information was extracted from the records of Mwema Enterprises for the period ending 31st December 2015.
Required
i) Trading profit and Loss A/C.
ii) Balance sheet
(Solved)
The following information was extracted from the records of Mwema Enterprises for the period ending 31st December 2015.
Required
i) Trading profit and Loss A/C.
ii) Balance sheet
Date posted:
September 4, 2019
.
Answers (1)
-
The following table shows the price of 2kg of maize flour 1 loaf of bread, and 1 packet of milk in 2013 and 2014 with...
(Solved)
The following table shows the price of 2kg of maize flour 1 loaf of bread, and 1 packet of milk in 2013 and 2014 with their weights.
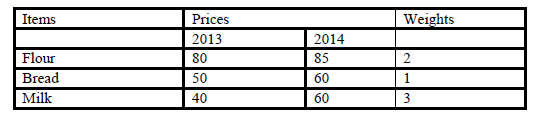
Required:
Calculate Consumer Price Index (C.P.I) for the year 2014 for the basket of goods composed of the three items using the Weighted Average Method and determine level of inflation.
Date posted:
September 4, 2019
.
Answers (1)
-
The following trial balance was extracted from the books of Jua Kali Trader as at 30th June 2016.
Stock as at 30th June 2016 was sh.70,000
(i)...
(Solved)
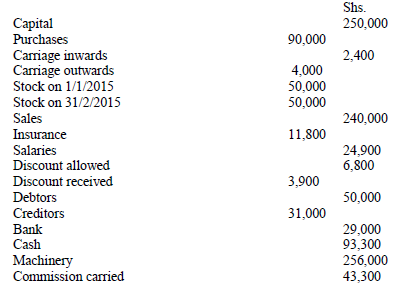
The following trial balance was extracted from the books of Jua Kali Trader as at 30th June 2016
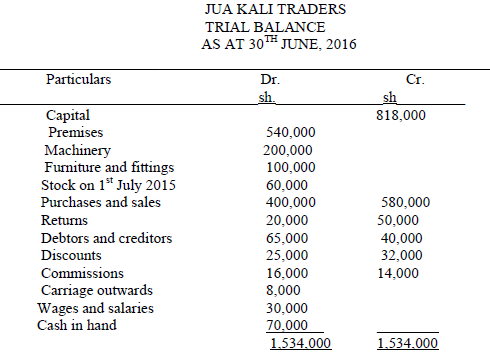
Stock as at 30th June 2016 was sh.70,000
(i) Prepare Jua Kali Traders trading, profit and loss account for the period ended 30th June 2016.
(ii) A balance sheet as at that date.
Date posted:
September 4, 2019
.
Answers (1)
-
Explain five reasons why a firm would prefer trade credit to a bank loan.
(Solved)
Explain five reasons why a firm would prefer trade credit to a bank loan.
Date posted:
September 4, 2019
.
Answers (1)
-
The table below shows source document state the book of original entry in which the information from these source documents would be recorded.
(Solved)
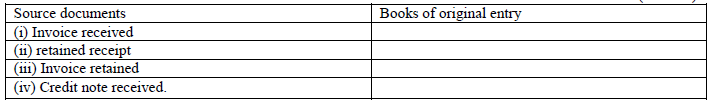
The table below shows source document state the book of original entry in which the information from these source documents would be recorded.
Date posted:
September 4, 2019
.
Answers (1)