-
The figure below shows an experimental set up consisting of a mounted convex lens L, cardboard screen with cross-wires at the centre, a plane mirror,...
(Solved)
The figure below shows an experimental set up consisting of a mounted convex lens L, cardboard screen with cross-wires at the centre, a plane mirror, a metre rule and a candle.
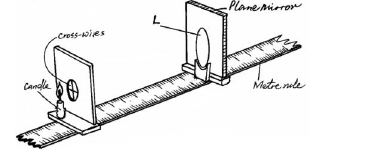
Describe how the set-up may be used to determine the focal length, f, of the lens.
Date posted:
September 10, 2019
.
Answers (1)
-
The figure below shows a wire carrying current whose direction is out of the paper. The wire is placed in a magnetic field.
(Solved)
The figure below shows a wire carrying current whose direction is out of the paper. The wire is placed in a magnetic field.
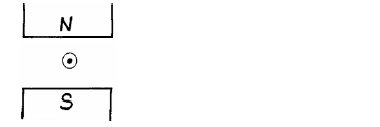
(a) Indicate on the figure the direction of the force F, acting on the wire.
(b) State what would be observed on the wire if the direction of the current is reversed (i.e. into the paper).
Date posted:
September 10, 2019
.
Answers (1)
-
The pressure of helium gas of volume 10cm³ decreases to one third of its original value at constant temperature.Determine the final volume of the gas.
(Solved)
The pressure of helium gas of volume 10cm³ decreases to one third of its original value at constant temperature.Determine the final volume of the gas.
Date posted:
September 10, 2019
.
Answers (1)
-
A beaker containing ether was placed on some water on a wooden block. Air was then blown through the ether using a pump as shown...
(Solved)
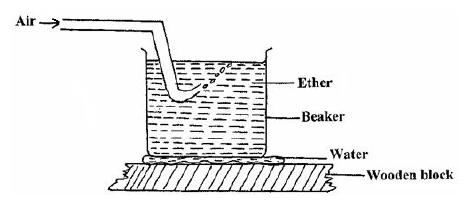
A beaker containing ether was placed on some water on a wooden block. Air was then blown through the ether using a pump as shown in figure below.State and explain what observation is made after sometime.
Date posted:
September 10, 2019
.
Answers (1)
-
The cooling curve shown in figure below is for a pure substance.
(Solved)
The cooling curve shown in figure below is for a pure substance.
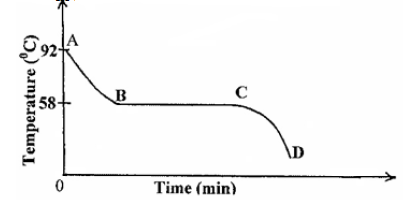
(i) What is the melting point of the substance?
(ii) Explain what happens in the region.
I CD
II AB
III BC
Date posted:
September 10, 2019
.
Answers (1)
-
The figure shows a wheel and axle being used to raise a load W by applying an effort F. the radius of the large wheel...
(Solved)
The figure shows a wheel and axle being used to raise a load W by applying an effort F. the radius of the large wheel is R and of the small wheel r as shown.
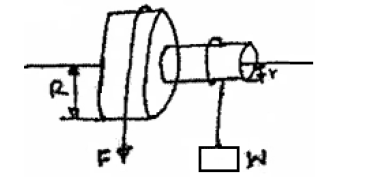
(i) Shows that the velocity ratio (V.R) of this machine is given by R/r.
(ii) Given that r = 5cm, R = 8cm, determine effort required to raise a load of 20N if the efficiency of the machine is 80%.
(iii) It is observed that the efficiency of the machines increases when it is used to lift large loads. Give a reason for this.
Date posted:
September 10, 2019
.
Answers (1)
-
Draw a single pulley arrangement with a velocity ratio of 2.
(Solved)
Draw a single pulley arrangement with a velocity ratio of 2.
Date posted:
September 10, 2019
.
Answers (1)
-
A ball of mass 0.2kg is thrown vertically upwards with velocity of 8ms¯¹. The air resistance is 0.5N. Determine:
(i) the resultant force on the ball...
(Solved)
A ball of mass 0.2kg is thrown vertically upwards with velocity of 8msˉ¹. The air resistance is 0.5N. Determine:
(i) the resultant force on the ball as it moves up;
(Take acceleration due to gravity g = 10msˉ²).
(ii) The acceleration of the ball.
(iii) The maximum height reached by the ball.
Date posted:
September 10, 2019
.
Answers (1)
-
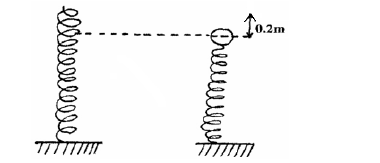
A steel ball of mass 0.05kg was placed on top of a spring on a level ground. The spring was then compressed through a distance...
(Solved)
A steel ball of mass 0.05kg was placed on top of a spring on a level ground. The spring was then compressed through a distance of 0.2m.If the spring constant is 15N/m. Calculate the maximum height reached when the spring is released.
Date posted:
September 10, 2019
.
Answers (1)
-
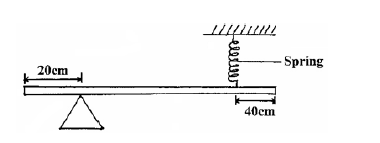
The figure below is a uniform bar of length 2.0m pivoted near one end. The bar is balanced horizontal by a spring.
(Solved)
The figure below is a uniform bar of length 2.0 m pivoted near one end. The bar is balanced horizontal by a spring.Given that the tension on the spring is 1.2N, determine the weight of the bar.
Date posted:
September 10, 2019
.
Answers (1)
-
A constant force is applied to a body moving with a constant speed. State one observable change in the state of motion of the body...
(Solved)
A constant force is applied to a body moving with a constant speed. State one observable change in the state of motion of the body likely to occur?
Date posted:
September 10, 2019
.
Answers (1)
-
The figure below shows part of micrometer screw gauge with 50 divisions on the thimble scale. Complete the diagram to show a reading of 5.73mm.
(Solved)
The figure below shows part of micrometer screw gauge with 50 divisions on the thimble scale. Complete the diagram to show a reading of 5.73mm.
Date posted:
September 10, 2019
.
Answers (1)
-
The figure below shows a measuring cylinder,which contains water initially at level A. A solid of mass 0.32g is immersed in the water,the level rises...
(Solved)
The figure below shows a measuring cylinder,which contains water initially at level A. A solid of mass 0.32g is immersed in the water,the level rises to B.
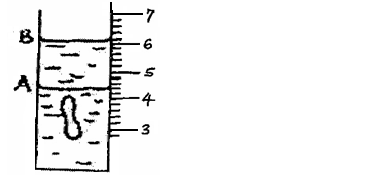
Determine the density of the solid. (Give your answer to 3 significant figures).
Date posted:
September 10, 2019
.
Answers (1)
-
The tube of a CRO is coated with graphite. State three functions of the graphite coating
(Solved)
The tube of a CRO is coated with graphite. State three functions of the graphite coating
Date posted:
September 10, 2019
.
Answers (1)
-
Distinguish between cathode rays and light rays.
(Solved)
Distinguish between cathode rays and light rays.
Date posted:
September 10, 2019
.
Answers (1)
-
The figure below show the displacement time graph of a wave traveling at 400cm/s.
(Solved)
The figure below show the displacement time graph of a wave traveling at 400cm/s.
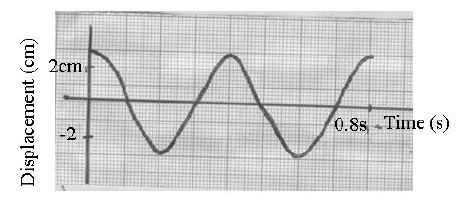
Determine for the wave the:
(i) Amplitude
(ii) Period
(iii) Frequency
(iv) Wavelength
Date posted:
September 10, 2019
.
Answers (1)
-
A mason uses a six wheel pulley system to raise a weight of 250N through a vertical height of 2.5m using the machine.If the mason...
(Solved)
A mason uses a six wheel pulley system to raise a weight of 250N through a vertical height of 2.5m using the machine.If the mason pulls using an effort of 500N. Calculate:
i) The velocity ratio of the pulley system.
ii) The work done by the mason.
iii) The useful work done by the pulley system.
iv) The efficiency of the system
Date posted:
September 10, 2019
.
Answers (1)
-
The figure below shows a block of mass 50g and density 2000kg/m3 submerged in a certain liquid and suspended from uniform horizontal beam by means...
(Solved)
The figure below shows a block of mass 50g and density 2000kg/m3 submerged in a certain liquid and suspended from uniform horizontal beam by means of a string. A mass of 40g suspended from the other end of the beam puts the system in equilibrium
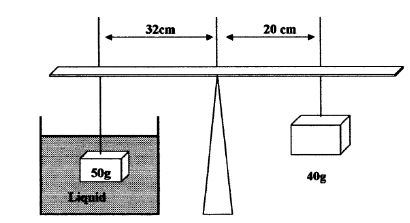
(i) Determine the up-thrust force acting on the block.
(ii) Calculate the density of the liquid.
(iii) Calculate the new balance point of the 50g mass (the 40g mass remains fixed) if the liquid was replace with one whose density was 1500kg/m3.
Date posted:
September 10, 2019
.
Answers (1)
-
A bullet moving at a velocity of 350m/s hits a tree trunk of diameter 70cm. It emerge from the opposite side with a velocity of...
(Solved)
A bullet moving at a velocity of 350m/s hits a tree trunk of diameter 70cm. It emerge from the opposite side with a velocity of 180m/s. Determine the average deceleration of the bullet in the trunk.
Date posted:
September 10, 2019
.
Answers (1)
-
The figure below shows an arrangement to demonstrate diffusion through solids.
(Solved)
The figure below shows an arrangement to demonstrate diffusion through solids.
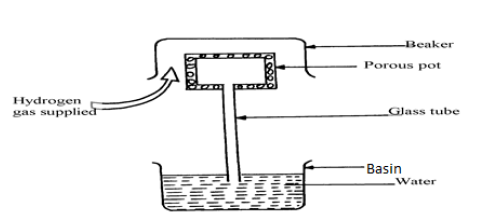
The hydrogen gas is supplied for sometimes then stopped and the beaker removed. State and explain what is likely t be observed when the hydrogen gas supply is stopped.
Date posted:
September 10, 2019
.
Answers (1)