-
The table below shows income Tax rates
(Solved)
The table below shows income Tax rates
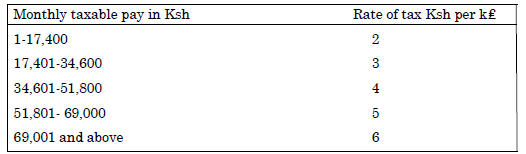
Faith earns a monthly basic salary of Ksh 45,000 and she is also given taxable allowances amounting to Ksh 20480 per month.
a) Calculate Faiths’ gross income tax per month.
b) Faith is entitled to a personal tax relief of Ksh 1162. Determine her net income per month.
c) Faith received 50% increase in her total income; calculate the corresponding percentage increase on the net income tax.
Date posted:
September 12, 2019
.
Answers (1)
-
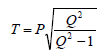
Make Q the subject of the formula
(Solved)
Make Q the subject of the formula
Date posted:
September 12, 2019
.
Answers (1)
-
A point P divides AB in the ratio 7: -5 where A (2,-3, 4) and B (-4, 7,-2). Find the coordinates of P.
(Solved)
A point P divides AB in the ratio 7: -5 where A (2,-3, 4) and B (-4, 7,-2). Find the coordinates of P.
Date posted:
September 12, 2019
.
Answers (1)
-
The diagram below shows a straight line intersecting the curve y = (x – 1)2 + 4
(Solved)
The diagram below shows a straight line intersecting the curve y = (x – 1)2 + 4 at the points P and Q. The line also cuts the x – axis at (7, 0) and y – axis at (0, 7)
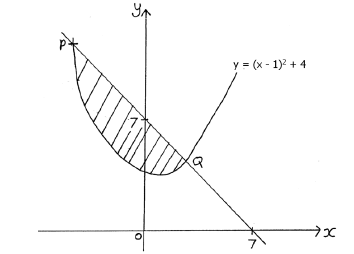
(a) Find the equation of the straight line in the form y = mx + c.
(b) Find the co-ordinates of P and Q
(c) Calculate the area of the shaded region.
Date posted:
September 11, 2019
.
Answers (1)
-
Three towns are located on the earth’s surface at the co-ordinates P(150N, 450E)
(Solved)
Three towns are located on the earth’s surface at the co-ordinates P(150N, 450E), Q(300S, 450E) and R(150N, 900E). A plane A flies from P to Q in 6 hours 40 minutes using the shortest route between the two towns. Another plane B takes off from town P at the same time as A and flies to town R along the parallel of latitude.
(a) Calculate the shortest distance between towns P and Q in km.
(b) Find the distance in km traveled by plane B between P and R to the nearest km
(c) If the two planes fly at the same speed determine to the nearest minute, which plane Reaches its destination earlier and by how long.
(Take pi=22/7 and radius of earth R = 6370km)
Date posted:
September 11, 2019
.
Answers (1)
-
The figure below is a rectangular base pyramid with the base ABCD and vertex V.
(Solved)
The figure below is a rectangular base pyramid with the base ABCD and vertex V.
VC=VB=VA=VD=39 AB=24 and BC = 18 EF = 8cm FG = 6cm
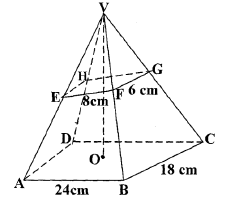
(a) Calculate the height VO of the Pyramid.
(b) The Pyramid is cut along a plane EFGH parallel to ABCD as shown.
(i) Calculate the angle between VHE and VBC
(ii) Calculate the angle between ABGH and ABCD
Date posted:
September 11, 2019
.
Answers (1)
-
A triangle T whose vertices are A (2,3) , B (5,3) and C (4,1) is mapped onto triangle T
(Solved)
A triangle T whose vertices are A (2,3) , B (5,3) and C (4,1) is mapped onto triangle T whose vertices are A1 (-4,3), B1 (-1,3) and C1 (x, y) by transformation

(a) Find the
(i) Matrix M of transformation.
(ii) Find the coordinates of C
(b) Triangle T2 is the image of triangle T1 under a reflection in the line y = x. Find single matrix that maps T onto T2
(c) Find the coordinates of T2
Date posted:
September 11, 2019
.
Answers (1)
-
(a) Complete the table below for the functions y = 2 Cos x and y = sin 2x
(Solved)
(a) Complete the table below for the functions y = 2 Cos x and y = sin2x for -180º ≤ x ≤ 180º
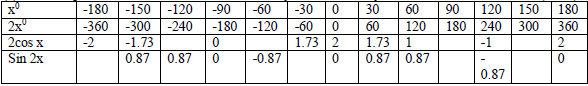
(b) On the grid provided, draw on the same axis the graphs of y = 2cos x and y sin 2x for -180º ≤ x ≤ 180º
(c) Use the graphs in (b) above to find;
(i) The values of x such that 2 cos x - sin 2x = 0
(ii) State the amplitude and period of graph y = 2 cos x.
(iii) Find the difference in the value of y when x = - 450
Date posted:
September 11, 2019
.
Answers (1)
-
The data below shows the age of 10 students picked at random in a secondary school
(Solved)
The data below shows the age of 10 students picked at random in a secondary school
6, 11, 13, 14, 8, 7, 12, 20, P and 9. If  ,determine the value of P hence, find the standard deviation to 3 d.p
Date posted:
September 11, 2019
.
Answers (1)
-
A quantity P varies jointly as Q and the square of R. If Q increased by 20% and R decreased by 15%.
(Solved)
A quantity P varies jointly as Q and the square of R. If Q increased by 20% and R decreased by 15%. Find the percentage change in P.
Date posted:
September 11, 2019
.
Answers (1)
-
The top of a table is a regular hexagon. Each side of the hexagon measures 50.0cm.
(Solved)
The top of a table is a regular hexagon. Each side of the hexagon measures 50.0cm. Find the Maximum percentage error in calculating the perimeter of the top of the table.
Date posted:
September 11, 2019
.
Answers (1)
-
Given that tan 650 = 3 + v5 , without using tables or calculator, determine tan 250
(Solved)
Given that tan 650 = 3 + √5 , without using tables or calculator, determine tan 250, leaving your answer in the form at a + b √c where a, b and c are rational numbers.
Date posted:
September 11, 2019
.
Answers (1)
-
Solve for x in the equation log8 (x + 5) – log8 (x – 3) = 2/3
(Solved)
Solve for x in the equation log8 (x + 5) – log8 (x – 3) = 2/3
Date posted:
September 11, 2019
.
Answers (1)
-
Make b the subject of the formula.
(Solved)
Make b the subject of the formula.

Date posted:
September 11, 2019
.
Answers (1)
-
The product of the first three terms of geometric progression is 729.
(Solved)
The product of the first three terms of geometric progression is 729. If the first term is a and the common ratio is r.
(a) Express r in terms of a.
(b) Given the sum of the three terms is 39.
(i) Find the values of a and r and hence write down two possible sequences each up to the 4th term.
(ii) Find the product of the 10th term of the two sequences.
Date posted:
September 11, 2019
.
Answers (1)
-
The diagram below shows triangle ABC, such that CA = 2a and CB = 3b.
(Solved)
The diagram below shows triangle ABC, such that CA = 2a and CB = 3b. M is the midpoint of CA. N is a point on AB such that 2 AN = NB and R is a point on AB produced such that 2 AR = 5RB. If K is the point of intersection of MR and CN,
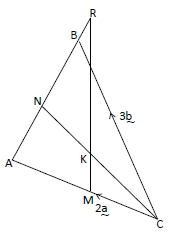
(a) Express in terms of a and b.
(i) AB.
(ii) CN.
(iii) BR.
(iv) MR.
(v) CK.
(b) Find the ratio CK: KN.
Date posted:
September 11, 2019
.
Answers (1)
-
Two quantities P and r are connected by the equation P = Krn. Where k and n are constants.The table of values of P and...
(Solved)
Two quantities P and r are connected by the equation P = Krⁿ. Where k and n are constants.The table of values of P and r is given below.
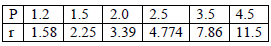
(a) State the linear equation connecting P and r.
(b) (i) Using a suitable scale, draw a suitable line graph from the above data on the grid provided.
(ii) Using your graph, estimate the values of K and n.
(c) Find the relation connecting P and r.
Date posted:
September 11, 2019
.
Answers (1)
-
The table below shows the distribution of marks scored by 50 students of Afraha high.
(Solved)
The table below shows the distribution of marks scored by 50 students of Afraha high.

Calculate:-
(a) interquartile range.
(b) Mean mark
(c) Standard deviation
Date posted:
September 11, 2019
.
Answers (1)
-
The figure below shows an arc of a circle through three points A, B and C.
(Solved)
The figure below shows an arc of a circle through three points A, B and C.
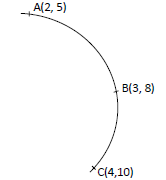
Calculate the co-ordinates of the centre of the circle.
Date posted:
September 11, 2019
.
Answers (1)
-
A commercial plot is valued at shs.500,000. The plot depreciates at a rate of 10% per six months for a period of 2 years.
(Solved)
A commercial plot is valued at shs.500,000. The plot depreciates at a rate of 10% per six months for a period of 2 years. It then appreciates at a rate of 4% per quarter yearly for three years. Find the value of the plot after 5 years to nearest shillings.
Date posted:
September 11, 2019
.
Answers (1)