-
The following results were obtained in a experiment to verify Hooke’s law when a spring was extended by hanging various loads on it.
(I) Complete...
(Solved)
The following results were obtained in a experiment to verify Hooke’s law when a spring was extended by hanging various loads on it.
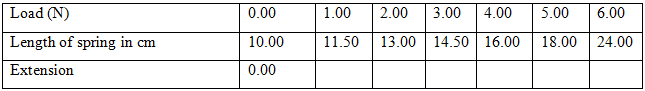
(I) Complete the table for the extension e above.
(II) Plot a graph of load (y-axis) against extension
(III) From the graph determine the springs constant
(IV) Calculate the energy stored when the spring is stretched to 16 cm.
Date posted:
October 1, 2019
.
Answers (1)
-
A stone of mass 5g is released from a catapult. The catapult is stretched by 10cm. If the constant of elasticity is 100N/cm. Calculate;
(i)...
(Solved)
A stone of mass 5g is released from a catapult. The catapult is stretched by 10cm. If the constant of elasticity is 100N/cm. Calculate;
(i) The horizontal velocity with which the stone is released
(ii) Sketch a graph of horizontal velocity against time from the time the stone is released to when it reaches the ground.
Date posted:
October 1, 2019
.
Answers (1)
-
The figure below shows the variation force with extension for a steel coil spring.
(i) On the same axes, sketch the variation of force with extension...
(Solved)
The figure below shows the variation force with extension for a steel coil spring.
(i) On the same axes, sketch the variation of force with extension for a wire form which the spring is made.
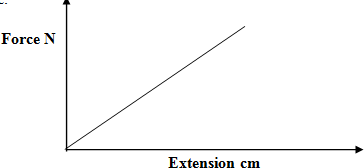
(ii) Explain the difference between the two lines drawn
Date posted:
October 1, 2019
.
Answers (1)
-
The figure below shows a section of a tape from a ten tick timer whose frequency is 50 Hz.
Calculate;
(i) The average velocity of the...
(Solved)
The figure below shows a section of a tape from a ten tick timer whose frequency is 50 Hz.
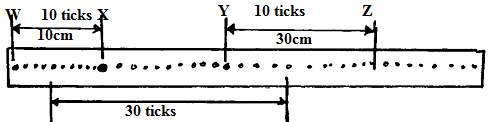
Calculate;
(i) The average velocity of the trolley between points
1. WX
2. YZ
(ii) Find the acceleration of the trolley.
Date posted:
October 1, 2019
.
Answers (1)
-
The velocity time graph in the figure below illustrates the motion of a ball which has been projected vertically upwards from the surface of...
(Solved)
The velocity time graph in the figure below illustrates the motion of a ball which has been projected vertically upwards from the surface of a planet. The weight of the ball on earth is 30N
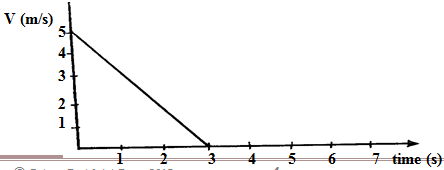
Determine the weight of a ball on the planet
Date posted:
October 1, 2019
.
Answers (1)
-
A modern car has a strengthened passenger cage but with front and back regions which can collapse in a crash. Explain how this collapsible...
(Solved)
A modern car has a strengthened passenger cage but with front and back regions which can collapse in a crash. Explain how this collapsible regions should reduce injury in a car crash.
Date posted:
October 1, 2019
.
Answers (1)
-
State one way of making surface tension of water stronger.
(Solved)
State one way of making surface tension of water stronger.
Date posted:
October 1, 2019
.
Answers (1)
-
Explain the washing effect of soap.
(Solved)
Explain the washing effect of soap.
Date posted:
October 1, 2019
.
Answers (1)
-
A bullet of mass 10g travelling at a speed of 400ms-1 hits a tree trunk, it penetrates the tree trunk and stops inside the trunk...
(Solved)
A bullet of mass 10g travelling at a speed of 400ms-1 hits a tree trunk, it penetrates the tree trunk and stops inside the trunk after 4 cm.
(a) Calculate the average resistance force offered by the trunk to the bullet.
(b) State the energy changes that takes place.
Date posted:
October 1, 2019
.
Answers (1)
-
Explain why a hole in a ship near the bottom is more dangerous than the one near the top
(Solved)
Explain why a hole in a ship near the bottom is more dangerous than the one near the top
Date posted:
October 1, 2019
.
Answers (1)
-
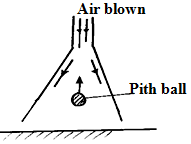
The figure below shows a pith ball being lifted into the funnel by blowing air into the funnel
Explain this observation
(Solved)
The figure below shows a pith ball being lifted into the funnel by blowing air into the funnel
Explain this observation
Date posted:
October 1, 2019
.
Answers (1)
-
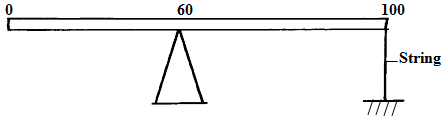
A uniform metre rule of mass 40g is pivoted at the 60cm mark and held horizontally with a vertical string as shown below. Determine the...
(Solved)
A uniform metre rule of mass 40g is pivoted at the 60cm mark and held horizontally with a vertical string as shown below. Determine the tension in the string.
Date posted:
October 1, 2019
.
Answers (1)
-
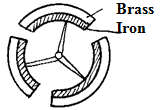
The figure below shows a bimetallic wheel whose diameter is not affected by changes in temperature. Briefly explain how the diameter of the wheel remain...
(Solved)
The figure below shows a bimetallic wheel whose diameter is not affected by changes in temperature. Briefly explain how the diameter of the wheel remain unchanged as the temperature increases
Date posted:
October 1, 2019
.
Answers (1)
-
The figure below shows part of a vernier caliper when the jaws are closed without an object between the jaws
(a) What is the value of...
(Solved)
The figure below shows part of a vernier caliper when the jaws are closed without an object between the jaws
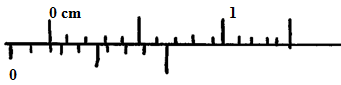
(a) What is the value of the zero error of the callipers?
(b) A student used the same vernier calipers in (a) above to measure the diameter of a test tube whose actual diameter is 2.15cm. what was the reading shown by the calipers.
Date posted:
October 1, 2019
.
Answers (1)
-
To determine the relationship between angular velocity w and tension T, a student used a smooth disc with a hole at the centre, a string...
(Solved)
To determine the relationship between angular velocity w and tension T, a student used a smooth disc with a hole at the centre, a string and cylindrical object of mass m, as shown below
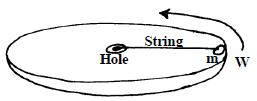
Describe how the student went about determining the relationship, specifying any other necessary material or instrument not shown in the diagram
Date posted:
October 1, 2019
.
Answers (1)
-
A bicycle wheel with radius 28cm moves with a linear velocity of 8m/s, determine
(Solved)
A bicycle wheel with radius 28cm moves with a linear velocity of 8m/s, determine
(i) the angular velocity of the wheel
(ii) the centripetal acceleration of a point on the rim of the wheel
Date posted:
October 1, 2019
.
Answers (1)
-
In an experiment, 100g of hot water at 90oC was mixed with 20g of ice at 0oC in a lagged plastics colorimeter.
(Solved)
In an experiment, 100g of hot water at 90oC was mixed with 20g of ice at 0oC in a lagged plastics colorimeter. After stirring, all the ice melted and the temperature of the mixture was found to be 61.5oC. Determine the latent heat of fusion of ice
(Specific heat capacity of water =4200Jkg-1k-1)
Date posted:
October 1, 2019
.
Answers (1)
-
A student set-up the apparatus as shown below to determine the power of an electric heater
(Solved)
A student set-up the apparatus as shown below to determine the power of an electric heater
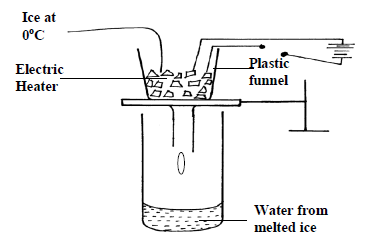
(i) Other than time, state the measurements that would be used to determine the quantity of heat P absorbed by ice in a unit time
(ii) Complete the circuit to show the connection of the essential circuit components
(iii) Describe how the student would proceed to determine P
(iv) Give a reason why P may not be equal to the value indicated by the manufacturer
Date posted:
October 1, 2019
.
Answers (1)
-
The readings tabulated below shows how the length of a helical spring varied with the load hanging on it
(Solved)
The readings tabulated below shows how the length of a helical spring varied with the load hanging on it
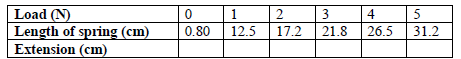
(i) Complete the table to show the values of extension
(ii) Draw a graph of extension (y-axis) against load for the spring
(iii) Determining form the graph the proportionality constant of the spring
Date posted:
October 1, 2019
.
Answers (1)
-
The diagram below shows two trolleys, A and B connected to each other by an elastic strip of negligible mass.
(Solved)
The diagram below shows two trolleys, A and B connected to each other by an elastic strip of negligible mass. The trolleys are pulled apart on a smooth plane till tension in the elastic strip is 4.0N and are then released suddenly
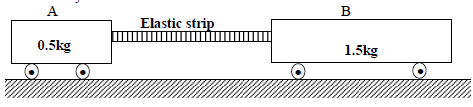
(a) State with reason the total momentum of the trolleys when they are just released
(b) Calculate the initial acceleration of trolley A when released
(c) The velocity of the trolley B is 0.9ms-1 just before it collides with A. Determine the velocity of A just before the collision
(d) Which trolley covers a longer distance before collision? Explain
(e) Explain why the elastic strip may not stretch to the same original length after impact
Date posted:
October 1, 2019
.
Answers (1)