i) X- Supply curve
Y- Demand curve
ii) Equilibrium point
iii)The higher the price the lower the quantity demanded and the lower the price the more the quantity demanded.
Kavungya answered the question on October 3, 2019 at 10:02
-
State four functions of the Agricultural Development Corporation (ADC).
(Solved)
State four functions of the Agricultural Development Corporation (ADC).
Date posted:
October 3, 2019
.
Answers (1)
-
The illustrations below show techniques of harvesting Agroforestry trees. Study them carefully and answer the questions that follow.
a)Identify the harvesting techniques illustrated by :-
A
B
C
b)Explain how...
(Solved)
The illustrations below show techniques of harvesting Agroforestry trees. Study them carefully and answer the questions that follow.
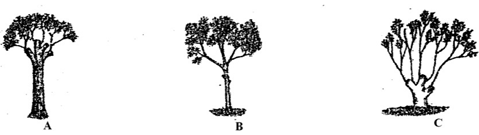
a)Identify the harvesting techniques illustrated by :-
A
B
C
b)Explain how technique C is carried out
Date posted:
October 3, 2019
.
Answers (1)
-
Describe the management practices that should be carried out on trees after transplanting In agroforestry
(Solved)
Describe the management practices that should be carried out on trees after transplanting In agroforestry
Date posted:
October 3, 2019
.
Answers (1)
-
Name two forms of Agroforestry.
(Solved)
Name two forms of Agroforestry.
Date posted:
October 3, 2019
.
Answers (1)
-
Give two practices in crop production that constitute organic farming
(Solved)
Give two practices in crop production that constitute organic farming
Date posted:
October 3, 2019
.
Answers (1)
-
Outline the benefits of primary cultivation.
(Solved)
Outline the benefits of primary cultivation.
Date posted:
September 30, 2019
.
Answers (1)
-
Give the main reasons for practicing up rotation.
(Solved)
Give the main reasons for practicing up rotation.
Date posted:
September 30, 2019
.
Answers (1)
-
Mr. Kamole was advised to apply 150 kg CAN/ha while top dressing maize .Calculate the amount of nitrogen applied per hectare if CAN contains 20%...
(Solved)
Mr. Kamole was advised to apply 150 kg CAN/ha while top dressing maize .Calculate the amount of nitrogen applied per hectare if CAN contains 20% nitrogen.
Date posted:
September 30, 2019
.
Answers (1)
-
The diagram below shows a common weed in crop land; use it to answer the following questionsbelow.(a) Identify the weed(b) State two harmful effects of...
(Solved)
The diagram below shows a common weed in crop land; use it to answer the following questions
below.

(a) Identify the weed
(b) State two harmful effects of the above weed.
(c) List two morphological features of the above weed that influence its selecting to herbicides.
Date posted:
September 30, 2019
.
Answers (1)
-
State two problems that may be brought by a hard pan.
(Solved)
State two problems that may be brought by a hard pan.
Date posted:
September 30, 2019
.
Answers (1)
-
Differentiate between the following breeds of livestock.
i) New Zealand white and Californian white.
ii) Large white and landrace
(Solved)
Differentiate between the following breeds of livestock.
i) New Zealand white and Californian white.
ii) Large white and landrace
Date posted:
September 30, 2019
.
Answers (1)
-
Discuss the importance of livestock to a Kenyan farmer.
(Solved)
Discuss the importance of livestock to a Kenyan farmer.
Date posted:
September 30, 2019
.
Answers (1)
-
List six different types of drainage.
(Solved)
List six different types of drainage.
Date posted:
September 30, 2019
.
Answers (1)
-
Give reasons why the burning of Bushes as a methods of land clearing should be discouraged.
(Solved)
Give reasons why the burning of Bushes as a methods of land clearing should be discouraged.
Date posted:
September 30, 2019
.
Answers (1)
-
Place the following tools in their respective categories and state their uses.
(Solved)
Place the following tools in their respective categories and state their uses.
a) Panga
b) Shovel
c) Pick axe
d) Garden line
e) Wheelbarrow
f) Sprayer
g) Ripsaw
h) Tape measure
i) Scraper
j) Marking gauge
Date posted:
September 30, 2019
.
Answers (1)
-
State two effect of HIV/AIDS on agriculture
(Solved)
State two effect of HIV/AIDS on agriculture.
Date posted:
September 30, 2019
.
Answers (1)
-
Give four reasons why Agriculture considered important in Kenya’s economy.
(Solved)
Give four reasons why Agriculture considered important in Kenya’s economy.
Date posted:
September 30, 2019
.
Answers (1)
-
A farmer with one hectare of land requires 40kg of n in his farm. He applied CAN which costs shs 35 per kg. CAN contain...
(Solved)
A farmer with one hectare of land requires 40kg of n in his farm. He applied CAN which costs shs 35 per kg. CAN contain 20kg N.
(a) Calculate the amount of C.A.N the farmer requires
(b) How much will a farmer with one and a half hectares spend to apply in his farm?
(c) Name two types of compound fertilizers used by farmers
Date posted:
September 30, 2019
.
Answers (1)
-
State four divisions of livestock farming.
(Solved)
State four divisions of livestock farming.
Date posted:
September 30, 2019
.
Answers (1)
-
State four vector-borne diseases affecting farm animals.
(Solved)
State four vector-borne diseases affecting farm animals.
Date posted:
September 30, 2019
.
Answers (1)