-
The table below shows the results of an experiment carried out to determine the rate of photosynthesis at different light intensities and varying Carbon (IV)...
(Solved)
The table below shows the results of an experiment carried out to determine the rate of photosynthesis at different light intensities and varying Carbon (IV) oxide concentrations. The rate was determined by counting the number of bubbles per minute. The temperature was kept constant.
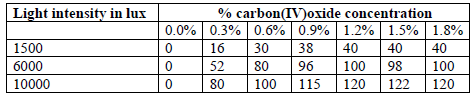
a) On a graph paper provided, draw a graph for each of the light intensities. All the three graphs should be plotted on the same axis (rate of photosynthesis on vertical axis and carbon (IV) oxide concentration on horizontal axis
b) What is the effect of an increase in carbon (IV) oxide concentrations and light intensities
c) Briefly explain how aquatic green plants meet light intensities and carbon (IV) oxide
requirement
d) Using the data provided in the table state two factors required by the green plants for food
production
Date posted:
October 4, 2019
.
Answers (1)
-
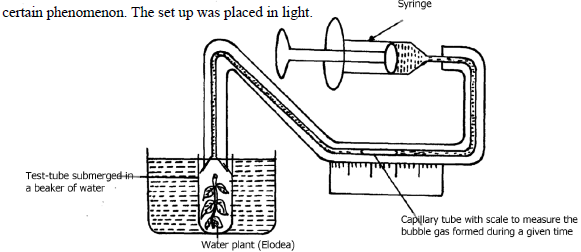
Form one students from Inungo school arranged their apparatus as shown below, to investigate a certain phenomenon. The set up was placed in light.
(Solved)
Form one students from Inungo school arranged their apparatus as shown below, to investigate a certain phenomenon. The set up was placed in light.
(a) State the likely aim of the set up
(b) State the role of the syringe in the set-up above
(c)
(i) Name gas X
(ii) Write an equation to show how gas X was formed in the set-up
(d) State three factors that increase the rate of enzyme activity
(e) Give a reason why the test tube is immersed in a beaker of water
Date posted:
October 4, 2019
.
Answers (1)
-
Describe how mammalian small intestine is adapted to its function.
(Solved)
Describe how mammalian small intestine is adapted to its function.
Date posted:
October 4, 2019
.
Answers (1)
-
The diagram below shows the effect of varying light intensity on the exchange of carbon IV oxide between the leaves of a green plant and...
(Solved)
The diagram below shows the effect of varying light intensity on the exchange of carbon IV oxide between the leaves of a green plant and the atmosphere.
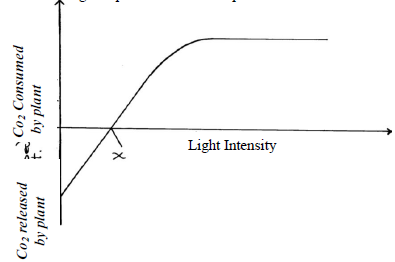
a) What is the name given to the point marked x?
b)
i) With reference to carbon IV oxide exchange state what happens at point x.
ii) Explain how the effect observed at point x occurs.
c) Explain why there is a net uptake of carbon IV oxide at light intensity above x.
d) What would happen to the plant if light intensity falling on it were maintained at x throughout?
e) What can you say about the exchange of oxygen between the plant and the surrounding air at intensities below x?
Date posted:
October 4, 2019
.
Answers (1)
-
The chart below shows the relationship between concentration of CO2 around the plant and the rate of photosynthesis.
(Solved)
The chart below shows the relationship between concentration of CO2 around the plant and the rate of photosynthesis.
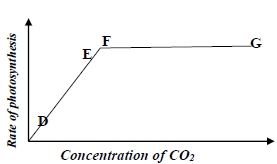
(a) Account for the rate of photosynthesis between D-E
(b) Account for the rate of photosynthesis between F-G
(c) Briefly describe the reactions during the light stage of photosynthesis
Date posted:
October 4, 2019
.
Answers (1)
-
The diagram below represents a longitudinal section through the ileum wall.
(Solved)
The diagram below represents a longitudinal section through the ileum wall.
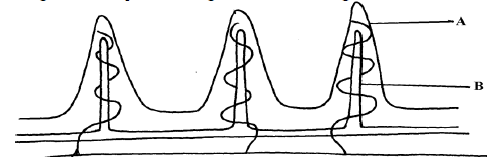
a) Identify the structure labeled A and B
b) State one function of A and B
c) State two functions of the ileum
d) Explain the role of the liver in digestion
e) State the endocrine role of the pancreas in a mammal
Date posted:
October 4, 2019
.
Answers (1)
-
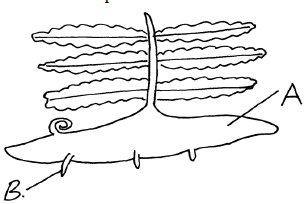
The figure below is a diagram of the anterior portion of the tapeworm. Taenia solium.
(Solved)
The figure below is a diagram of the anterior portion of the tapeworm. Taenia solium.
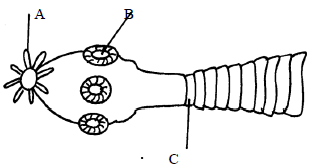
(a) Name the parts labeled A, B, and C
(b) What is the intermediate host of Taenia Solium?
Date posted:
October 4, 2019
.
Answers (1)
-
The figure shows the effect of temperature on an enzyme catalyzed reaction.
(Solved)
The figure shows the effect of temperature on an enzyme catalyzed reaction.
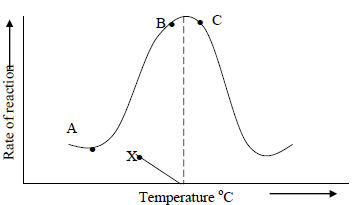
(a) Explain what happens between A and B
(b) What is X?
Date posted:
October 4, 2019
.
Answers (1)
-
The diagram below shows a leaf of a growing plant partly covered with aluminium foil.
The plant was placed in the sun from morning to midday...
(Solved)
The diagram below shows a leaf of a growing plant partly covered with aluminium foil.
The plant was placed in the sun from morning to midday and then tested for starch.
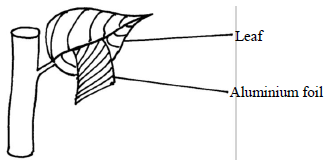
(a) What was the aim of the experiment?
(b) State the observation made when the leaf was tested for starch.
Date posted:
October 4, 2019
.
Answers (1)
-
Study the diagram below and answer the questions that follow.
(Solved)
Study the diagram below and answer the questions that follow.
(a) Label the parts A and B
(b) State one observable difference between the structure above and the liverwort
Date posted:
October 4, 2019
.
Answers (1)
-
Explain why small mammals such as moles feed more frequently than larger ones such as elephants.
(Solved)
Explain why small mammals such as moles feed more frequently than larger ones such as elephants.
Date posted:
October 4, 2019
.
Answers (1)
-
Study the dental formula given below.
(Solved)
Study the dental formula given below.
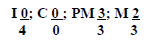
(a) Identify with reasons the mode of feeding of the animals whose dental formula is given above
(b) Calculate the total number of teeth in the mouth of the above animal
Date posted:
October 4, 2019
.
Answers (1)
-
State three ways by which the rate of enzyme controlled reactions can be increased.
(Solved)
State three ways by which the rate of enzyme controlled reactions can be increased.
Date posted:
October 4, 2019
.
Answers (1)
-
The concentration of carbon IV oxide in a tropical forest was measured during the course of 24 hour period from mid-night. The graph below shows...
(Solved)
The concentration of carbon IV oxide in a tropical forest was measured during the course of 24 hour period from mid-night. The graph below shows the results obtained.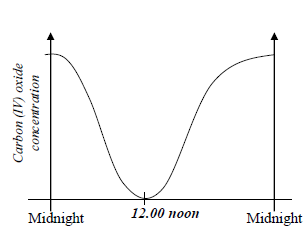
Account for the results obtained at:
(i) Midnight.
(ii) At 12.00 noon
Date posted:
October 4, 2019
.
Answers (1)
-
a)Name the specific part of the chloroplast where the following processes occur.
(Solved)
a)Name the specific part of the chloroplast where the following processes occur.
(i) Carbon IV oxide fixation
(ii) Photolysis
(b) State one way in which the dark reactions of photosynthesis depends on light reaction.
Date posted:
October 4, 2019
.
Answers (1)
-
The table below shows three enzymes A, B and C and their respective optimum pH.
(Solved)
The table below shows three enzymes A, B and C and their respective optimum pH.
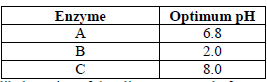
(i) Name the most likely region of the alimentary canal of a mammal where enzyme B would be found.
(ii) Give a reason for your answer in (a) (i) above
Date posted:
October 4, 2019
.
Answers (1)
-
The diagram below represents a cell organelle
(Solved)
The diagram below represents a cell organelle.
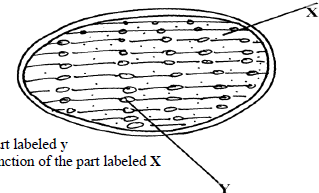
(i) Name the part labeled y
(ii) State the function of the part labeled X
State the function of the vitamin named in (i) above
Date posted:
October 4, 2019
.
Answers (1)
-
Below is a process that takes place along the mammalian digestive system.
(Solved)
Below is a process that takes place along the mammalian digestive system.
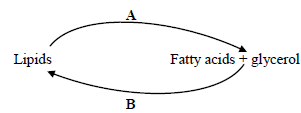
(a) Name the processes represented by A and B
(b) Name part of the alimentary canal where the process B takes place
Date posted:
October 4, 2019
.
Answers (1)
-
Briefly explain the fate of the following products from the light stage of the process of
Photosynthesis:
(a) Oxygen
(b) Hydrogen
(c) ATP
(Solved)
Briefly explain the fate of the following products from the light stage of the process of
Photosynthesis:
(a) Oxygen
(b) Hydrogen
(c) ATP
Date posted:
October 3, 2019
.
Answers (1)
-
State two ways in which guard cells differ from other epidermal cells.
(Solved)
State two ways in which guard cells differ from other epidermal cells.
Date posted:
October 3, 2019
.
Answers (1)