-
Unemployment has been major problem that the Kenyan government has been trying to solve. Explain any five measures that the Kenyan government has taken to...
(Solved)
Unemployment has been major problem that the Kenyan government has been trying to solve. Explain any five measures that the Kenyan government has taken to solve this problem.
Date posted:
October 11, 2019
.
Answers (1)
-
The following trial balance relates to XYZ ltd.
(Solved)
The following trial balance relates to XYZ ltd.
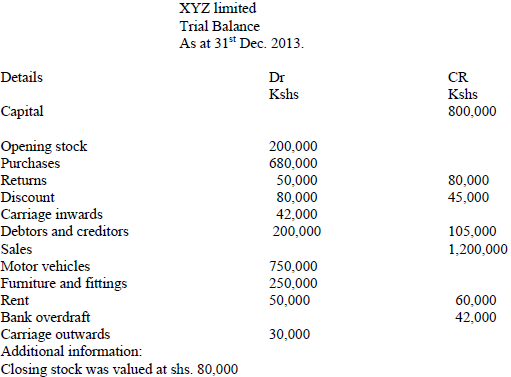
Required:
Prepare XYZ limited Trading, profit and loss account.
Date posted:
October 11, 2019
.
Answers (1)
-
Explain five benefits that Kenya enjoys by being a member of the African development Bank.
(Solved)
Explain five benefits that Kenya enjoys by being a member of the African development Bank.
Date posted:
October 11, 2019
.
Answers (1)
-
On 1st September 2015, Kakamega Traders had shs55, 000 in hand and shs 250,000 in Bank. During the month, the following transactions took place.
(Solved)
On 1st September 2015, Kakamega Traders had shs55, 000 in hand and shs 250,000 in Bank. During the month, the following transactions took place.
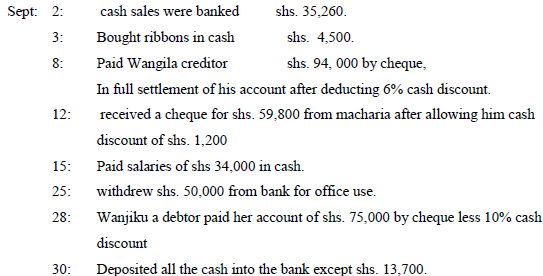
Required: Prepare Kakamega Traders 3 –column cash book and balance it off.
Date posted:
October 11, 2019
.
Answers (1)
-
Explain five features that would be considered when establishing a warehouse for imported goods.
(Solved)
Explain five features that would be considered when establishing a warehouse for imported goods.
Date posted:
October 11, 2019
.
Answers (1)
-
The table shows some occupation in production .Indicate the level of production associated with each of the following occupations.
(Solved)
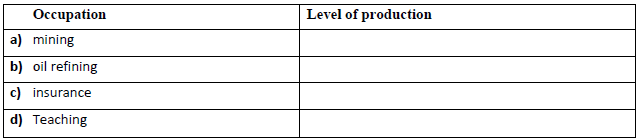
The table shows some occupation in production .Indicate the level of production associated with each of the following occupations.
Date posted:
October 11, 2019
.
Answers (1)
-
Identify four reasons why consumers prepare a scale of preference before spending money on goods and services.
(Solved)
Identify four reasons why consumers prepare a scale of preference before spending money on goods and services.
Date posted:
October 11, 2019
.
Answers (1)
-
Kenya has recently discovered crude oil in Turkana. Outline four advantages of transporting the oil through pipeline.
(Solved)
Kenya has recently discovered crude oil in Turkana. Outline four advantages of transporting the oil through pipeline.
Date posted:
October 11, 2019
.
Answers (1)
-
On 2nd November 2006 Kinoti received an invoice of Ksh. 12,000.Terms of payment were trade discount 5% and cash discount of 10% if payment is...
(Solved)
On 2nd November 2006 Kinoti received an invoice of Ksh. 12,000.Terms of payment were trade discount 5% and cash discount of 10% if payment is made within 30days. Determine the amount paid if payment was made on 28th November 2006.
Date posted:
October 11, 2019
.
Answers (1)
-
Mobile phones have become a common means of communication in Kenya today. State four challenges that a trader may encounter when using mobile phones.
(Solved)
Mobile phones have become a common means of communication in Kenya today. State four challenges that a trader may encounter when using mobile phones.
Date posted:
October 11, 2019
.
Answers (1)
-
Outline four benefits that Kenyan government may get as a member of common market for Eastern and Southern Africa (COMESA)
(Solved)
Outline four benefits that Kenyan government may get as a member of common market for Eastern and Southern Africa (COMESA).
Date posted:
October 11, 2019
.
Answers (1)
-
For each of the following books of original entry indicate the source document used.
a)Purchase journal
b)Cash payment journal
c)Purchase returns journal
d)Sales returns journal
(Solved)
For each of the following books of original entry indicate the source document used.
a)Purchase journal
b)Cash payment journal
c)Purchase returns journal
d)Sales returns journal
Date posted:
October 11, 2019
.
Answers (1)
-
Identify four ways in which consumers can be exploited by traders.
(Solved)
Identify four ways in which consumers can be exploited by traders.
Date posted:
October 11, 2019
.
Answers (1)
-
Explain five ways of making face-to-face communication effective.
(Solved)
Explain five ways of making face-to-face communication effective.
Date posted:
October 9, 2019
.
Answers (1)
-
Outline four ways in which students can prevent unemployment in the future after high school.
(Solved)
Outline four ways in which students can prevent unemployment in the future after high school.
Date posted:
October 9, 2019
.
Answers (1)
-
Highlight four reasons why most businesses in Kenya operate on small scale basis.
(Solved)
Highlight four reasons why most businesses in Kenya operate on small scale basis.
Date posted:
October 8, 2019
.
Answers (1)
-
List the ways in which insecurity negatively affects running of business activities.
(Solved)
List the ways in which insecurity negatively affects running of business activities.
Date posted:
October 7, 2019
.
Answers (1)
-
Gatundu wholesalers have been buying sugar directly from Mumias Sugar Company. Explain five services offered by Gatundu wholesalers to Mumias Sugar Company.
(Solved)
Gatundu wholesalers have been buying sugar directly from Mumias Sugar Company. Explain five services offered by Gatundu wholesalers to Mumias Sugar Company.
Date posted:
October 4, 2019
.
Answers (1)
-
Record the following transaction in a two column cash book.
2012
Jan 1: Started business with capital of sh20,000 cash and sh 50,000 at bank.
...
(Solved)
Record the following transaction in a two column cash book.
2012
Jan 1: Started business with capital of sh20,000 cash and sh 50,000 at bank.
2: Bought stock in cash sh 120,000
3: Cash sales sh 5,000
7: Bought stock worth sh 10,000 on credit.
12: Withdrew cash from bank for office use sh.8,000.
15: Paid rent by cheque shs 6000.
20: Received shs 4000 by cheque from a debtor.
Date posted:
October 4, 2019
.
Answers (1)
-
Identify the terms given to each of the following statements.
a.Transport goods from producers to consumers
b.Activities carried out with a view of making profit.
c.A person...
(Solved)
Identify the terms given to each of the following statements.
a.Transport goods from producers to consumers
b.Activities carried out with a view of making profit.
c.A person who uses a good or service.
d.Increasing the usefulness of a good or services
Date posted:
October 4, 2019
.
Answers (1)