a)TU – The gaseous substance cools by losing heat
b)UV – the substance changes to liquid state at constant temperature
b)VW – The substance (liquid) cools by losing heat
Kavungya answered the question on November 1, 2019 at 07:41
-
The flow chart below illustrates the extraction of Zinc. Study it and answer the questions that follow:
(Solved)
The flow chart below illustrates the extraction of Zinc. Study it and answer the questions that follow:
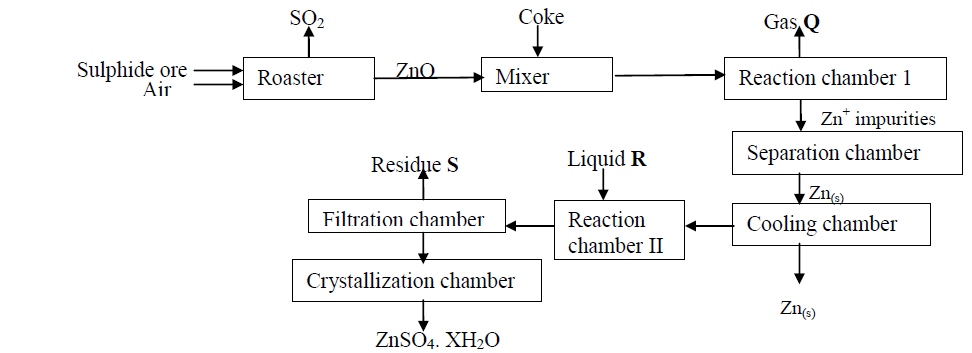
a) Name:-
i) Gas Q
ii) Liquid R
(iii) Residues S
b) Name the sulphide ore used
c) Before the ore is roasted, it is first concentrated;
(i) Explain why it is necessary to concentrate the ore
(ii) Explain briefly the process of concentrating the ore
d) Write an equation for the reaction that takes place in the:-
(i) Roaster
(ii) Reaction chamber
(e) (i) Name one major impurity present in the sulphide ore used
(ii) Write an equation to show how the impurity in (e)(i) above is removed
f) Given that the sulphide ore contains only 45% Zinc sulphide by mass, calculate :
(i) The mass in grams of Zinc sulphide that would be obtained from 250kg of the ore.
(ii) The volume of Sulphur (IV) oxide that would be obtained from the mass of sulphide
ore at room temperature and pressure
(Zn = 65.4, S = 32.0, O= 16.0, I mole of gas occupies 24.0 liters at r.t.p)
Date posted:
November 1, 2019
.
Answers (1)
-
The diagram below is a flow chart for the extraction of copper. Study it and answer the questions that follow:
(Solved)
The diagram below is a flow chart for the extraction of copper. Study it and answer the questions that follow:
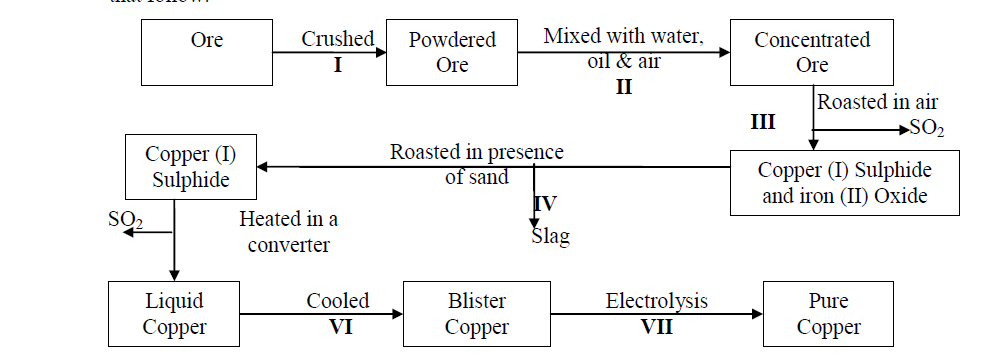
(a) Write the formula of the major ore of copper metal
(b) Name process II
(c) Give an equation for the reaction that occurs in stage III
(d) Explain what happens in stage IV
(e) Write half cell equations occurring at the anode and cathode in stage VII
(f) Draw a simple diagram showing the set-up that is used in electrolytic purification of copper
Date posted:
November 1, 2019
.
Answers (1)
-
The flow chart below shows steps used in the extraction of zinc from one of its ores.
(Solved)
The flow chart below shows steps used in the extraction of zinc from one of its ores.
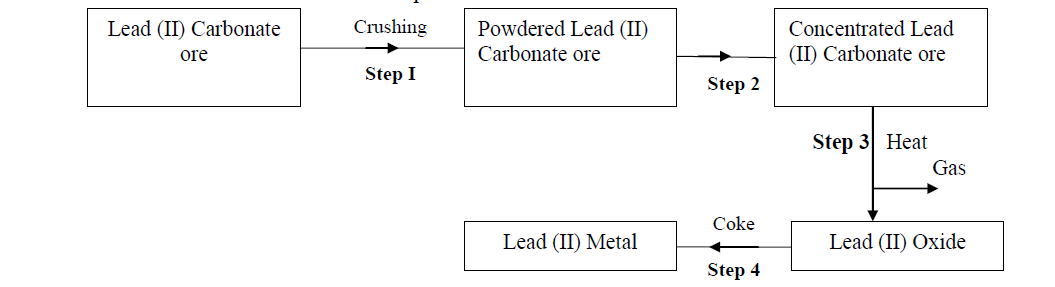
(a) Name the process that is used in step 2 to concentrate the ore
(b) Write an equation for the reaction which takes place in step 3
Date posted:
November 1, 2019
.
Answers (1)
-
The stages shown in the following diagram can be used to extract zinc from its oxide.
Name the stage and the process taking place in it:-
(Solved)
The stages shown in the following diagram can be used to extract zinc from its oxide.
Name the stage and the process taking place in it:-
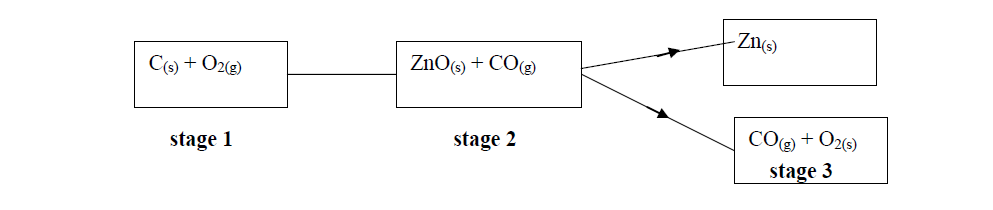
Stage 1
Stage 2
Stage 3
Date posted:
November 1, 2019
.
Answers (1)
-
What properties of aluminium and its alloys make it suitable for use in making aircraft parts
(Solved)
What properties of aluminium and its alloys make it suitable for use in making aircraft parts
Date posted:
November 1, 2019
.
Answers (1)
-
Suggest one manufacturing plant that can be set up near zinc extraction plant. Give
reasons for your answer
(Solved)
Suggest one manufacturing plant that can be set up near zinc extraction plant. Give
reasons for your answer
Date posted:
November 1, 2019
.
Answers (1)
-
Give one environmental hazard associated with the extraction of zinc metal
(Solved)
Give one environmental hazard associated with the extraction of zinc metal
Date posted:
November 1, 2019
.
Answers (1)
-
You are provided with 20.0cm3 of 2M sodium hydroxide solution. Explain how you would prepare a solution of sodium hydroxide whose concentration is 0.16M.
(Solved)
You are provided with 20.0cm3 of 2M sodium hydroxide solution. Explain how you would prepare a solution of sodium hydroxide whose concentration is 0.16M.
Date posted:
October 31, 2019
.
Answers (1)
-
The following diagram represents the electrolysis of dilute sodium chloride solution using inert
electrodes
(Solved)
The following diagram represents the electrolysis of dilute sodium chloride solution using inert
electrodes
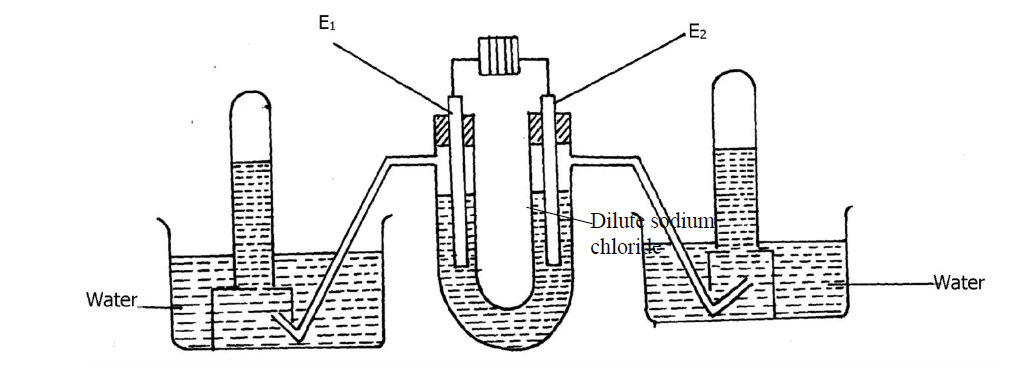
Determine the electrode at which different electrolytic products would be produced if the solution is electrolysed for several hours. Explain
Date posted:
October 31, 2019
.
Answers (1)
-
The standard hydrogen electrode is used as the reference electrode. Some of the difficulties in using hydrogen gas as an electrode are:
(Solved)
The standard hydrogen electrode is used as the reference electrode. Some of the difficulties in using hydrogen gas as an electrode are:
- Hydrogen is a gas at 25oC
- Hydrogen does not conduct electricity
-The half-cell reaction,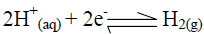 is slow and takes long to reach equilibrium.
Explain how these difficulties are solved in the standard hydrogen electrode
Date posted:
October 31, 2019
.
Answers (1)
-
Give the chemical formula of Zinc blende
(Solved)
Give the chemical formula of Zinc blende
Date posted:
October 31, 2019
.
Answers (1)
-
The following is an equation for the reaction between ammonia and water
(Solved)
The following is an equation for the reaction between ammonia and water

Name the base in the backward reaction
Date posted:
October 31, 2019
.
Answers (1)
-
Calculate the volume at s.t.p of hydrogen evolved when 2A of electricity are passed
through dilute sulphuric acid for 2hours.
(Molar gas volume at s.t.p = 22.4dm3,...
(Solved)
Calculate the volume at s.t.p of hydrogen evolved when 2A of electricity are passed
through dilute sulphuric acid for 2hours.
(Molar gas volume at s.t.p = 22.4dm3, one Faraday= 96500coulombs)
Date posted:
October 31, 2019
.
Answers (1)
-
State Faradays First Law of Electrolysis
(Solved)
State Faradays First Law of Electrolysis
Date posted:
October 31, 2019
.
Answers (1)
-
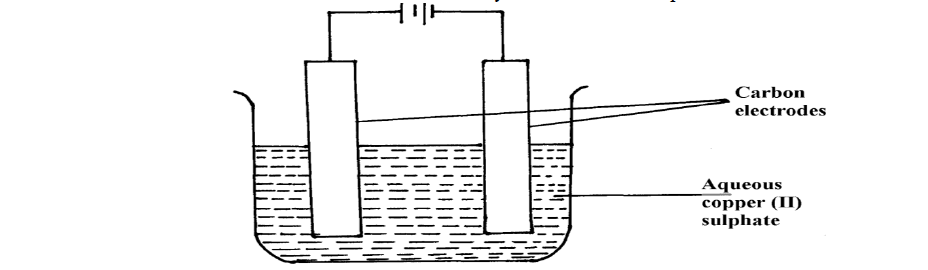
Copper (II) sulphate solution was electrolysed using copper electrode. A Current of 0.5A was passed for 64.3 minutes and a mass of 0.64g of copper...
(Solved)
Copper (II) sulphate solution was electrolysed using copper electrode. A Current of 0.5A was
passed for 64.3 minutes and a mass of 0.64g of copper was deposited. (Cu = 63.5)
a) Which electrode decreased in mass during electrolysis? Explain
b) Calculate the quantity of charge needed to deposits 1 mole of copper
Date posted:
October 31, 2019
.
Answers (1)
-
A student set up the experiment shown below. Study it and answer the questions that follow.
(Solved)
A student set up the experiment shown below. Study it and answer the questions that follow.
a) State any two observations the student made during the experiment
b) Explain what happens to the pH of the resultant solution at the end of the experiment
Date posted:
October 31, 2019
.
Answers (1)
-
The following table shows the standard reduction potentials of some half cells. Study the table and refer to it to answer the questions that follow;
(Solved)
The following table shows the standard reduction potentials of some half cells. Study the table and refer to it to answer the questions that follow;
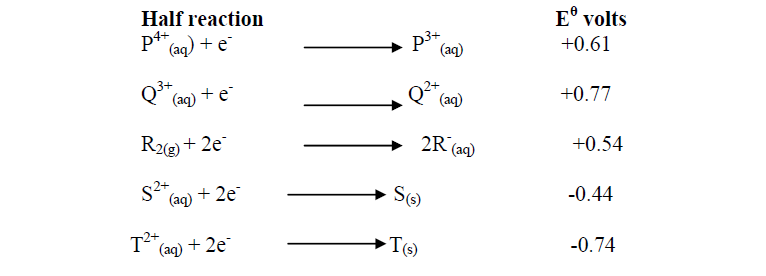
a) Identify the strongest oxidizing agent
b) Which substance would be used to oxidize R- ion to the atom R
c) Study the cell represented below;

i) Identify the electrodes
ii) Write equations for the reaction taking place in each half- cell
iii) Determine the cell equation and the electromotive force (e.m.f) of the cell represented in
(c) above
iv) In which direction does the electrons flow in the external circuit of the cell whose e.m.f
is determined in (iii) above
d) A steady current of 2.5A was passed for 15 minutes through a cell containing divalent ions
M2+. During this process 0.74g of metal M was deposited (IF = 96500C)
i) Calculate the quantity of electricity passed in this cell
ii) Determine the relative atomic mass of M
Date posted:
October 31, 2019
.
Answers (1)
-
Sodium hydroxide may be manufactured by the electrolysis of brine as in the diagram below:-
(Solved)
Sodium hydroxide may be manufactured by the electrolysis of brine as in the diagram below:-
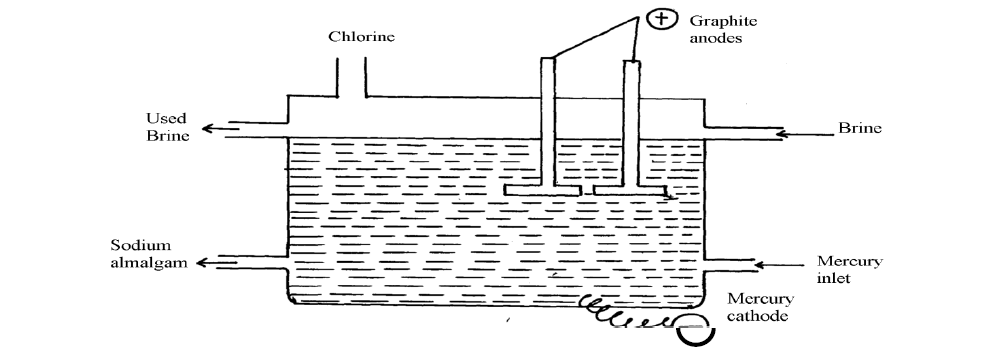
(i) State the chemical name of brine
(ii) Write the equations for the reactions at the electrodes
-Anode
-Cathode
(iii) Explain how sodium hydroxide is obtained from the product of this process
Date posted:
October 31, 2019
.
Answers (1)
-
The diagram below shows a Zinc –copper cell.
(Solved)
The diagram below shows a Zinc –copper cell.

(i) Given the standard electrode potential of Zinc is -0.76V and that of copper is +0.34V, suggest;
(i)The identity of W
(ii) The identity of X
(iii) The equation for the overall cell reaction
(iv) The reading on the voltmeter
Date posted:
October 31, 2019
.
Answers (1)
-
Cheptoo set-up some apparatus as shown in the diagram below:-
(Solved)
Cheptoo set-up some apparatus as shown in the diagram below:-
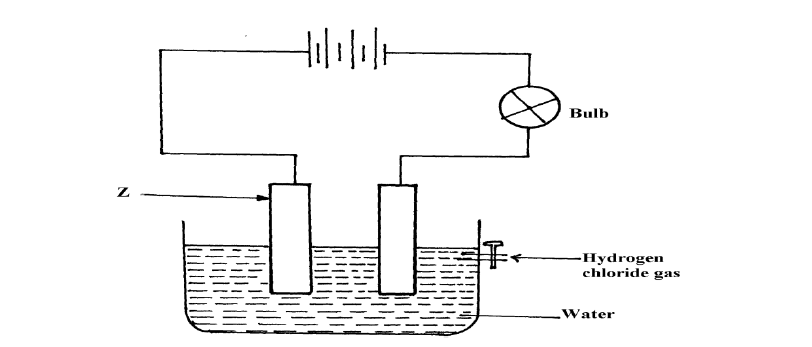
At the start of the experiment, the bulb did not light:-
(a) State and explain the observation made when the tap was opened to allow the hydrogen chloride gas through the water for about 20 minutes
(b) Write the chemical equation for the reaction that took place at the cathode
Date posted:
October 31, 2019
.
Answers (1)