-
What is the difference between uniform linear motion and uniform circular motion?
(Solved)
What is the difference between uniform linear motion and uniform circular motion?
Date posted:
November 4, 2019
.
Answers (1)
-
The figure below shows a 4m long uniform metal rod balanced horizontally when two forces act on it as shown.
Determine the value of F given...
(Solved)
The figure below shows a 4m long uniform metal rod balanced horizontally when two forces act on it as shown.
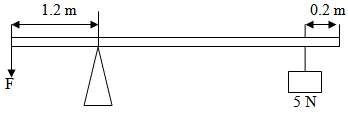
Determine the value of F given that the rod weighs 8 N.
Date posted:
November 4, 2019
.
Answers (1)
-
The temperature of water in a measuring cylinder is raised from 0oC to 15oC. Sketch the graph of volume against temperature.
(Solved)
The temperature of water in a measuring cylinder is raised from 0oC to 15oC. Sketch the graph of volume against temperature.
Date posted:
November 4, 2019
.
Answers (1)
-
The micrometer screw gauge shown in figure below had a zero error of – 0.05 mm and was used to measure the diameter of a...
(Solved)
The micrometer screw gauge shown in figure below had a zero error of – 0.05 mm and was used to measure the diameter of a steel ball bearing.
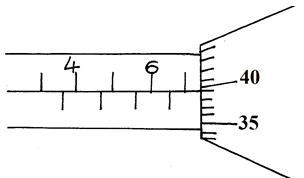
Find the radius of the ball bearing whose diameter is recorded by the instrument.
Date posted:
November 4, 2019
.
Answers (1)
-
Why do you think we experience more discomfort in hot humid weather than we do in hot dry weather.
(Solved)
Why do you think we experience more discomfort in hot humid weather than we do in hot dry weather.
Date posted:
October 30, 2019
.
Answers (1)
-
In demagnetization by electrical method:
i) State the type of current used.
ii) Explain your answer in (i) above.
(Solved)
In demagnetization by electrical method:
i) State the type of current used.
ii) Explain your answer in (i) above.
Date posted:
October 30, 2019
.
Answers (1)
-
The figure below shows a method of magnetization used in making magnets.
i)Name the method.
ii) Identify the polarities A and B of the magnet produced.
iii) Apart...
(Solved)
The figure below shows a method of magnetization used in making magnets.
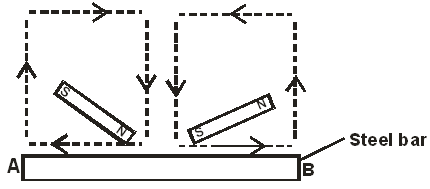
i)Name the method.
ii) Identify the polarities A and B of the magnet produced.
iii) Apart from this method, state any other method used in magnetization.
Date posted:
October 30, 2019
.
Answers (1)
-
A surface whose work function is 2.46eV is illuminated by light of frequency 3.0×10¹⁵Hz. Calculate the maximum kinetic energy of the ejected photoelectrons.
(Solved)
A surface whose work function is 2.46eV is illuminated by light of frequency 3.0×10¹⁵Hz. Calculate the maximum kinetic energy of the ejected photoelectrons.
Date posted:
October 30, 2019
.
Answers (1)
-
The figure below shows the essential components of an x-ray tube
a)Name the parts labelled A and B.
b)Explain how electrons are produced.
c)During the operation of the...
(Solved)
The figure below shows the essential components of an x-ray tube
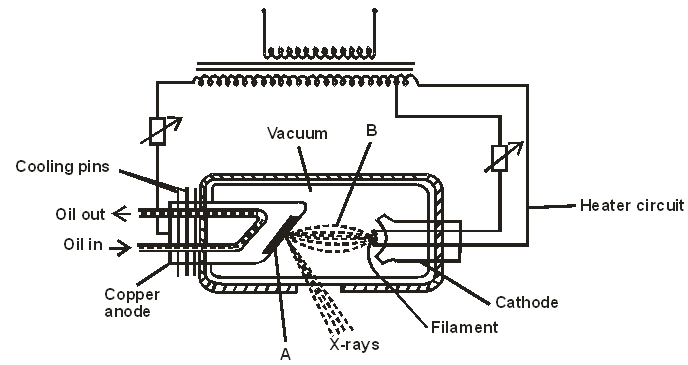
a)Name the parts labelled A and B.
b)Explain how electrons are produced.
c)During the operation of the tube, the target becomes very hot.
i)Explain how this heat is caused.
ii)State any two ways in which cooling can be achieved.
d)Explain why:
i)The tube is evacuated.
ii)The cathode is concave shaped.
Date posted:
October 30, 2019
.
Answers (1)
-
A transformer uses 240V a.c supply to deliver 9.0A at 80V to a heating coil. If 10% of the energy taken from the supply is...
(Solved)
A transformer uses 240V a.c supply to deliver 9.0A at 80V to a heating coil. If 10% of the energy taken from the supply is lost in the transformer itself, determine the current in the primary winding.
Date posted:
October 30, 2019
.
Answers (1)
-
A fishing boat uses ultrasound of frequency 6.0×10⁴Hz to detect fish directly below. Two echoes of the ultrasound are received, one after 0.09 seconds coming...
(Solved)
A fishing boat uses ultrasound of frequency 6.0×10⁴Hz to detect fish directly below. Two echoes of the ultrasound are received, one after 0.09 seconds coming from the shoal of fish and the other after 0.12 seconds coming from the sea bed. The sea bed is 84m below the ultrasound transceiver.
i) State two reasons why ultrasound is preferred.
ii) Calculate the speed of the ultrasound waves in water.
Date posted:
October 30, 2019
.
Answers (1)
-
The diagram below shows a set up that was used to demonstrate that, sound is a mechanical wave.
i) State the function of the vacuum pump.
ii)...
(Solved)
The diagram below shows a set up that was used to demonstrate that, sound is a mechanical wave.
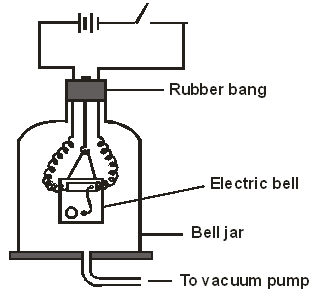
i) State the function of the vacuum pump.
ii) When the switch is closed, state and explain what happens as the air is continuously drawn from the bell jar.
iii)State two possible reasons why it is not possible to reduce the sound completely in this experiment.
Date posted:
October 30, 2019
.
Answers (1)
-
A lens forms an image that is four times the size of the object on the screen. The distance between the object and the screen...
(Solved)
A lens forms an image that is four times the size of the object on the screen. The distance between the object and the screen is 120cm.
i)State the type of lens used.
ii)Calculate the focal length of the lens.
Date posted:
October 30, 2019
.
Answers (1)
-
Diffraction is not a common phenomenon in light. Explain why.
(Solved)
Diffraction is not a common phenomenon in light. Explain why.
Date posted:
October 30, 2019
.
Answers (1)
-
With the help of a diagram(s) show the difference between half-wave rectification and full-wave rectification output.
(Solved)
With the help of a diagram(s) show the difference between half-wave rectification and full-wave rectification output.
Date posted:
October 30, 2019
.
Answers (1)
-
The activity of a radioactive source is initially 450 counts per second. After 72 hours, it reduces to 100 counts per second. If the background...
(Solved)
The activity of a radioactive source is initially 450 counts per second. After 72 hours, it reduces to 100 counts per second. If the background count per second is 50, determine the half-life of the substance.
Date posted:
October 30, 2019
.
Answers (1)
-
A gas container of volume 1.5×10⁻⁵m3 contains an ideal gas at a temperature of 270C and pressure 1.0×10⁵ pa. Determine the volume of the gas...
(Solved)
A gas container of volume 1.5×10⁻⁵m3 contains an ideal gas at a temperature of 270C and pressure 1.0×10⁵ pa. Determine the volume of the gas when cooled to 170C and its pressure raised to 1.5×10⁵ pa.
Date posted:
October 30, 2019
.
Answers (1)
-
In an experiment to determine the specific latent heat of vaporization of water, steam at 1000C was passed into water contained in a well lagged...
(Solved)
In an experiment to determine the specific latent heat of vaporization of water, steam at 1000C was passed into water contained in a well lagged copper calorimeter. The following measurements were made:
- Mass of calorimeter = 55g
- Initial mass of water = 75g
-Final mass of calorimeter + water + condensed steam = 133g
- Final temperature of the mixture = 300C.
Specific heat capacity of water = 4200J/Kg/K.
Specific heat capacity of copper = 390J/Kg/K.
Determine the:
i)Mass of condensed steam
ii)Heat gained by the calorimeter and water if the initial temperature of the calorimeter
+ water = 200C
iii)Given that L is the specific latent heat of vaporization of steam.
(I)Write an expression for the heat given out by steam.
(II)Determine the value of L.
Date posted:
October 30, 2019
.
Answers (1)
-
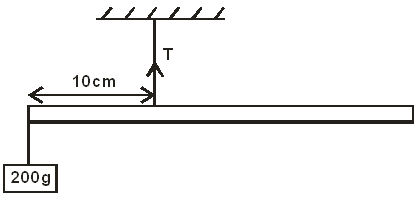
Figure below shows a uniform metre rule balancing when a mass of 200g is hung at one end.
Determine the tension T in the string.
(Solved)
Figure below shows a uniform metre rule balancing when a mass of 200g is hung at one end.
Determine the tension T in the string.
Date posted:
October 30, 2019
.
Answers (1)
-
The figure below shows a measuring cylinder which contains water initially at a level A.
A spherical solid is immersed in the water and the level...
(Solved)
The figure below shows a measuring cylinder which contains water initially at a level A.
A spherical solid is immersed in the water and the level rises to B.
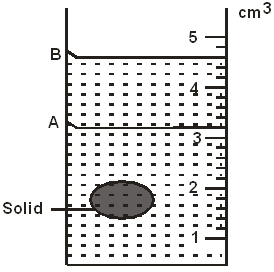
Determine the diameter of the spherical ball.
Date posted:
October 30, 2019
.
Answers (1)