-
(a) Using trapezoidal rule estimate the area bounded by the curve y=3x2 - 2 and the lines x=-4 ,x=4 and x-axis.
(b) find the actual area...
(Solved)
(a) Using trapezoidal rule estimate the area bounded by the curve y=3x2 − 2 and the lines x=−4 ,x=4 and x−axis.
(b) find the actual area bounded by the curve y=3x2 − 2 and the lines x=−4 ,x=4 and x−axis.
(c) Calculate the percentage error when trapezoidal rule is used.
Date posted:
November 12, 2019
.
Answers (1)
-
The probability that a boy goes to school by bus is 1/3 and by matatu is ½. If he uses a bus the probability that...
(Solved)
The probability that a boy goes to school by bus is 1/3 and by matatu is ½. If he uses a bus the probability that he is late to school is 1/5 and if he uses a matatu the probability of being late is 3/10. If he uses other means of transport, the probability of being late is 1/20. What is he probability that;
(a) He will be late to school
(b) He will not be late to school
(c) He will be late to school if he does not use a matatu
(d) He neither uses a bus nor matatu but arrives to school early.
Date posted:
November 12, 2019
.
Answers (1)
-
The first term of A.P is 3.5, the common difference is d if the difference of 20th and 6th terms is 40.
(a) (i)find the common...
(Solved)
The first term of A.P is 3.5, the common difference is d if the difference of 20th and 6th terms is 40.
(a) (i)find the common difference, d
(ii) calculate the sum of the first 40 terms of the AP
(b) The progression is such that the 2nd , 14th and 85th terms of the AP forms the first 3 terms of a G.P. If the common difference of A.P is 2.5
Find
(i) 2nd term of the G.P
(ii) Sum of the two 10 terms of G.P
Date posted:
November 12, 2019
.
Answers (1)
-
An aeroplane that moves at a constant speed of 600 knots flies from town A (140N, 300W) southwards to town B (X0S, 300W) taking 3...
(Solved)
An aeroplane that moves at a constant speed of 600 knots flies from town A (140N, 300W) southwards to town B (X0S, 300W) taking 3 1/2 hrs. It then changes direction and flies along latitude to town C (X0S, 600E). Given π = 3.142 and radius of the earth R= 6370 km
(a) Calculate
(i) The value of X
(ii) The distance between town B and town C along the parallel of latitude in km.
(b) D is an airport situated at (50N, 1200W), calculate
(i) The time the aeroplane would take to fly from C to D following a great circle through the South Pole.
(ii) The local time at D when the local time at A is 12.20 pm
Date posted:
November 12, 2019
.
Answers (1)
-
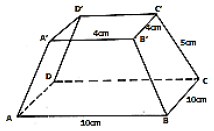
The figure below shows a frustum of a square based pyramid (not drawn to scale). The base ABCD is a square of sides 10cm. The...
(Solved)
The figure below shows a frustum of a square based pyramid (not drawn to scale). The base ABCD is a square of sides 10cm. The top A’B’C’D’ is a square of side 4 cm and each slant edges of the frustum is 5cm long. Calculate the angle between AC’ and the line AC.
Date posted:
November 12, 2019
.
Answers (1)
-
Draw a line DF = 4.6cm.Construct the locus of point K above DF such that angle DKF = 700.
(Solved)
Draw a line DF = 4.6cm.Construct the locus of point K above DF such that angle DKF = 700.
Date posted:
November 12, 2019
.
Answers (1)
-
Triangle ABC has vertices A(1,0), B(4,0) and C(1,4) is mapped onto A’B’C’ under a shear matrix, x axis invariant and C(1,4) is mapped onto C’(7,4)....
(Solved)
Triangle ABC has vertices A(1,0), B(4,0) and C(1,4) is mapped onto A’B’C’ under a shear matrix, x axis invariant and C(1,4) is mapped onto C’(7,4). Find the shear matrix hence find the coordinates of the image of P(2,-3) and Q(-2,-3).
Date posted:
November 12, 2019
.
Answers (1)
-
Calculate all the values of x between -180° and +180° which satisfy the equation 6 cos (x - 30)° = -3.
(Solved)
Calculate all the values of x between -180° and +180° which satisfy the equation 6 cos (x − 30)° = −3.
Date posted:
November 12, 2019
.
Answers (1)
-
The cost of a matatu was sh. 950 000.It depreciated in value by 5% per year for the first 2 years and 15% per for...
(Solved)
The cost of a matatu was sh. 950 000.It depreciated in value by 5% per year for the first 2 years and 15% per for the subsequent years. Calculate the value of the matatu after 5 years.
Date posted:
November 12, 2019
.
Answers (1)
-
Given that P varies directly as V and inversely as the cube root of R and that P = 12 when V = 3 and...
(Solved)
Given that P varies directly as V and inversely as the cube root of R and that P = 12 when V = 3 and R = 2,
(i) Find an equation connecting P, V and R.
(ii) Find the percentage change in P if V is increased by 12% and R decreased by 36%
Date posted:
November 12, 2019
.
Answers (1)
-
The radius and height of a cylindrical Kentank rounded to 1 cm are 105 cm and 300 cm respectively.
Calculate the percentage error in its volume.
(Solved)
The radius and height of a cylindrical Kentank rounded to 1 cm are 105 cm and 300 cm respectively.
Calculate the percentage error in its volume.
Date posted:
November 12, 2019
.
Answers (1)
-
Given that and that a and b are rational numbers, find the values of a and b.
(Solved)
Given that 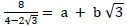 and that a and b are rational numbers, find the values of a and b.
Date posted:
November 12, 2019
.
Answers (1)
-
Use the method of completing the square to solve
4 - 9x - 3x2 = 0
(Solved)
Use the method of completing the square to solve
4 − 9x − 3x2 = 0
Date posted:
November 12, 2019
.
Answers (1)
-
Solve for x in log3 = log5 0.5.
(Solved)
Solve for x in log3  = log5 0.5.
Date posted:
November 12, 2019
.
Answers (1)
-
(a) Expand and simplify (x - 1/2x)6 up to the term in x3 and state the constant term.
(b) Use this expansion to calculate to...
(Solved)
(a) Expand and simplify (x − 1/2x)6 up to the term in x3 and state the constant term.
(b) Use this expansion to calculate to 4 d.p the value of (0.96)6.
Date posted:
November 12, 2019
.
Answers (1)
-
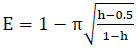
Make h the subject of the formula.
(Solved)
Make h the subject of the formula.
Date posted:
November 12, 2019
.
Answers (1)
-
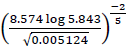
In this question, show all the steps in your calculations, giving the answer at each stage. Use logarithms correct to decimal places, to evaluate.
(Solved)
In this question, show all the steps in your calculations, giving the answer at each stage. Use logarithms correct to decimal places, to evaluate.
Date posted:
November 12, 2019
.
Answers (1)
-
The speed of projectile v m/s at a given time t is given by v=10(10t-t2)
(Solved)
The speed of projectile v m/s at a given time t is given by v=10(10t-t2) calculate
a. The time when the velocity is maximum
b. The maximum velocity attained
c. The distance traveled by the body in the first 6 seconds
d. The acceleration of the projectile at t=6.5sec
Date posted:
November 12, 2019
.
Answers (1)
-
(a) Complete the table below for the function y = 2x2 + 3x – 5.(b) On the grid provided draw the graph of y =...
(Solved)
(a) Complete the table below for the function y = 2x2 + 3x – 5.
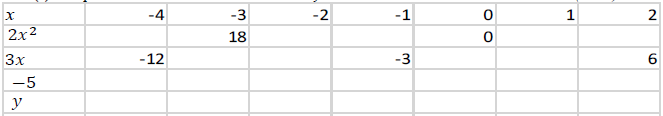
(b) On the grid provided draw the graph of y = 2x2 + 3x – 5 for -4 = x = 2
(c) Use your graph to state the roots of
(i) 2x2 + 3x – 5 = 0
(ii) 2x2 + 6x – 2 = 0
Date posted:
November 12, 2019
.
Answers (1)
-
Four towns A, B, C and D are such that B is 84km direct to the north of A and C is on a bearing...
(Solved)
Four towns A, B, C and D are such that B is 84km direct to the north of A and C is on a bearing of N 65oW from A at a distance of 60km. D is on a bearing of 340o from C at a distance of 30km. Using a scale of 1 cm rep 10km
a) Make an accurate scale drawing showing the relative positions of the towns
b) Find the distance and bearing of B from C
c) Find the distance and bearing of D from B
d) Find the bearing of A from D
Date posted:
November 12, 2019
.
Answers (1)