 Get premium membership
 and access questions with answers, video lessons as well as revision papers.
- The acceleration of a body moving along a straight line is (2t – 1)m/s2 and its velocity is vm/s after t seconds.
(i) If the initial...(Solved)
The acceleration of a body moving along a straight line is (2t – 1)m/s2 and its velocity is vm/s after t seconds.
(i) If the initial velocity of the body is 4m/s , express v in terms of t .
(ii) Find the velocity of the body after 4 seconds
(iii) Calculate the time taken to attain the maximum velocity.
(iv) The distance covered by the body to attain maximum velocity.
Date posted: November 15, 2019. Answers (1)
- A varies directly as M and inversely as the square root of Q. Given that A = 280,and M = 40 when Q = 16:
(a)...(Solved)
A varies directly as M and inversely as the square root of Q. Given that A = 280,and M = 40 when Q = 16:
(a) find A when Q = 9 and M =36
(b) Find the value of M when A = 400 and Q = 0.64.
(c) if Q is increased by 26%band M decreased by 20%, find the percentage change in A.
Date posted: November 15, 2019. Answers (1)
- (a) Using mid - ordinate rule, estimate the area under the curve y = x2 – 2, using six strips between x =2 , x...(Solved)
(a) Using mid - ordinate rule, estimate the area under the curve y = x2 – 2, using six strips between x =2 , x = 8 and x-axis
(b) (i) Use integration to determine the exact area under the curve.
(ii) find the percentage error in calculating the area using the mid – ordinate rule.
Date posted: November 15, 2019. Answers (1)
- The equation of a curve is given by y = 2+ 2cos theta(a) Complete the table below for the function y = 2 + 2cos...(Solved)
The equation of a curve is given by y = 2+ 2cos theta
(a) Complete the table below for the function y = 2 + 2cos theta

(b) (i) On the grid draw the graph of y = 2 + 2cos theta for the range given in the table above.
(ii) State the amplitude and the period of the curve.
(c) On the same grid , plot the graph of y = tan theta for the range 900 = ? = 2700
(d) Using the graphs drawn solve the equation 2 + 2 cos theta = tan for 900 = ? = 2700
Date posted: November 15, 2019. Answers (1)
- The 1st , 7th, and 25th terms of an arithmetic progression are the first three consecutive terms of a geometrical progression. The 20th term of...(Solved)
The 1st , 7th, and 25th terms of an arithmetic progression are the first three consecutive terms of a geometrical progression. The 20th term of the arithmetic progression is 22. Find:
1.(i) The first term and the common difference of the arithmetic progression.
(ii) The sum of the first 20 terms of the arithmetic progression.
2.(i) The 7th term of the geometric progression.
(ii) the sum of the first six terms of them geometric progression.
Date posted: November 15, 2019. Answers (1)
- ABCDEFGH is a cube of 12cm.
(a) Find:
(i) AC
(ii) EC
(b) The angle between EC and the plane ABCD.
(c) The angle between the plane...(Solved)
ABCDEFGH is a cube of 12cm.
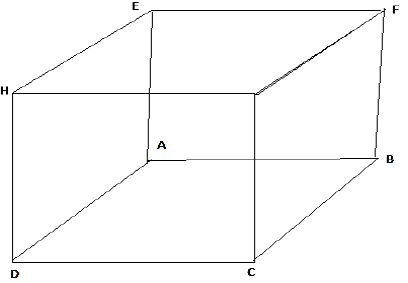
(a) Find:
(i) AC
(ii) EC
(b) The angle between EC and the plane ABCD.
(c) The angle between the plane EBCH and BCGF
Date posted: November 15, 2019. Answers (1)
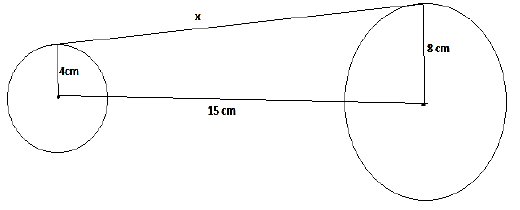
- Two circles of radii 4cm and 8cm are positioned in such way that theirs centres are 15cm apart as shown below. Find x.(Solved)
Two circles of radii 4cm and 8cm are positioned in such way that theirs centres are 15cm apart as shown below. Find x.
Date posted: November 15, 2019. Answers (1)
- The Morans basketball team measured the length and width of their basketball court and found it to be 15.2m and 28.4m respectively. calculate to 2...(Solved)
The Morans basketball team measured the length and width of their basketball court and found it to be 15.2m and 28.4m respectively. calculate to 2 decimal places the percentage error in its area.
Date posted: November 15, 2019. Answers (1)
- Find the centre and radius of the circle whose equation is 2x2 + 2y2 - 12x + 20y – 4 = 0.(Solved)
Find the centre and radius of the circle whose equation is 2x2 + 2y2 - 12x + 20y – 4 = 0.
Date posted: November 15, 2019. Answers (1)
- A tea dealer has two brands of tea , brand P and brand Q . one kilogram of brand P and one kilogram of brand...(Solved)
A tea dealer has two brands of tea , brand P and brand Q . one kilogram of brand P and one kilogram of brand Q costs ksh 86 and ksh 74 respectively . in what ratio should she mix them to have a brand which costs ksh 78 a kilograms?
Date posted: November 15, 2019. Answers (1)
- Ngere Tea Factory depends on two sources of light energy at night , Diesel Engine powered generator or Mains electricity. The probability that the generator...(Solved)
Ngere Tea Factory depends on two sources of light energy at night , Diesel Engine powered generator or Mains electricity. The probability that the generator fails is 0.16 while the probability that there is Mains Electricity power blackout is 0.26 calculate the probability that:
(i) there are both sources of power
(ii) there is total blackout in the entire factory.
Date posted: November 15, 2019. Answers (1)
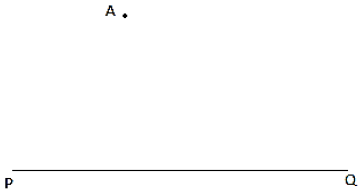
- Below is a line PQ and a point A. Determine the locus of a point K which is equidistant from P and Q and is...(Solved)
Below is a line PQ and a point A. Determine the locus of a point K which is equidistant from P and Q and is 3cm from A.
Date posted: November 15, 2019. Answers (1)
- (i) Using binomial expansion to expand up to the term x-3(ii) Use the expansion above to evaluate 3.45(Solved)
(i) Using binomial expansion to expand  up to the term x-3
(ii) Use the expansion above to evaluate (3.4)5
Date posted: November 15, 2019. Answers (1)
- Make N the subject of the formula E =(Solved)
Make N the subject of the formula E = 
Date posted: November 15, 2019. Answers (1)
- Simplify(Solved)
Simplify 
Date posted: November 15, 2019. Answers (1)
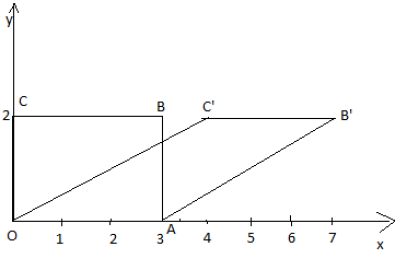
- A transformation M maps a rectangle OABC onto OAB’C’. Describe the transformation and write down the matrix for M.(Solved)
A transformation M maps a rectangle OABC onto OAB’C’. Describe the transformation and write down the matrix for M.
Date posted: November 15, 2019. Answers (1)
- Evaluate(Solved)
Evaluate 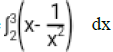
Date posted: November 15, 2019. Answers (1)
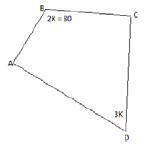
- ABCD is a cyclic quadrilateral. Find k.(Solved)
ABCD is a cyclic quadrilateral. Find k.
Date posted: November 15, 2019. Answers (1)
- Solve for x in 4 sinx – 4 cos2 x = -1 for 0 = x = 3600.(Solved)
Solve for x in 4 sinx – 4 cos2 x = -1 for 0 ≤ x ≤ 3600.
Date posted: November 15, 2019. Answers (1)
- P is ( 12,-6, 9) and Q (3, 18, -12). A is the point which divides PQ in the ratio 2: 1. Find the coordinates...(Solved)
P is ( 12,-6, 9) and Q (3, 18, -12). A is the point which divides PQ in the ratio 2: 1. Find the coordinates of A and express PA in terms of i ,j and k.
Date posted: November 15, 2019. Answers (1)