-
In a triangle ABC, BC=8cm, AC=12cm and angle ABC=120°
a) Calculate the length of AB, correct to one decimal place
b) If BC is the base...
(Solved)
In a triangle ABC, BC=8cm, AC=12cm and angle ABC=120°
a) Calculate the length of AB, correct to one decimal place
b) If BC is the base of the triangle, calculate correct to one decimal place
i. The perpendicular height of the triangle
ii. The area of the triangle
iii. The size of angle ACB
Date posted:
November 15, 2019
.
Answers (1)
-
A straight line passes through the point (-3, -4) and is perpendicular to the line where equation is 3x + 2y = 11 and intersects...
(Solved)
A straight line passes through the point (-3, -4) and is perpendicular to the line where equation is 3x + 2y = 11 and intersects the x-axis and y-axis at points A and B respectively. Find the length AB.
Date posted:
November 15, 2019
.
Answers (1)
-
Expand and simplify the expression (2x2 – 3y3)2 + 12x2y3.
(Solved)
Expand and simplify the expression (2x2 – 3y3)2 + 12x2y3.
Date posted:
November 15, 2019
.
Answers (1)
-
Given that Cos(x -20)° = Sin(2x + 32)° and x is an acute angle, find Tan (x – 4)°.
(Solved)
Given that Cos(x -20)° = Sin(2x + 32)° and x is an acute angle, find Tan (x – 4)°.
Date posted:
November 15, 2019
.
Answers (1)
-
Given that Log a = 0.30 and Log b = 0.48: find the value of Log b2/a.
(Solved)
Given that Log a = 0.30 and Log b = 0.48: find the value of Log b2/a.
Date posted:
November 15, 2019
.
Answers (1)
-
(a) Using mid - ordinate rule, estimate the area under the curve y = x2 – 2, using six strips between x =2 , x...
(Solved)
(a) Using mid - ordinate rule, estimate the area under the curve y = x2 – 2, using six strips between x =2 , x = 8 and x-axis
(b) (i) Use integration to determine the exact area under the curve.
(ii) find the percentage error in calculating the area using the mid – ordinate rule.
Date posted:
November 15, 2019
.
Answers (1)
-
The 1st , 7th, and 25th terms of an arithmetic progression are the first three consecutive terms of a geometrical progression. The 20th term of...
(Solved)
The 1st , 7th, and 25th terms of an arithmetic progression are the first three consecutive terms of a geometrical progression. The 20th term of the arithmetic progression is 22. Find:
1.(i) The first term and the common difference of the arithmetic progression.
(ii) The sum of the first 20 terms of the arithmetic progression.
2.(i) The 7th term of the geometric progression.
(ii) the sum of the first six terms of them geometric progression.
Date posted:
November 15, 2019
.
Answers (1)
-
A curve whose gradient function is dy/dx = 3x2 +10x +3 passes through point (-2, -3)
a) Find the equation of the curve
b) i) Determine...
(Solved)
A curve whose gradient function is dy/dx = 3x2 +10x +3 passes through point (-2, -3)
a) Find the equation of the curve
b) i) Determine the turning points
ii) Sketch the curve
Date posted:
November 14, 2019
.
Answers (1)
-
The diagram below represents a conical vessel which stands vertically. The vessels contains water to a depth of 30cm. The radius of...
(Solved)
The diagram below represents a conical vessel which stands vertically. The vessels contains water to a depth of 30cm. The radius of the surface in the vessel is 21cm. (Take ?? = 22/7)
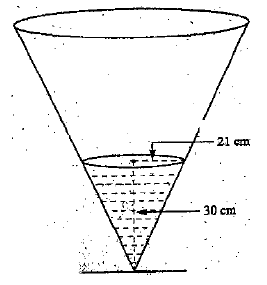
a) Calculate the volume of the water in the vessels in cm3
b) When a metal sphere is completely submerged in the water, the level of the water in the vessels rises by 6cm.
Calculate:
i) The radius of the new water surface in the vessel;
ii) The volume of the metal sphere in cm3
ii) The radius of the sphere
Date posted:
November 14, 2019
.
Answers (1)
-
(a) Draw the graph of y = 2 + 3x - x2 in the range of - 3 = x = 6 on the grid...
(Solved)
(a) Draw the graph of y = 2 + 3x − x2 in the range of − 3 ≤ x ≤ 6 on the grid provided.
b) From your graph:-
(i) Find the value of x if x2 − 4x = 0
(ii) Determine the value of x for which y is the greatest.
(iii) Determine the range of values of x for which y is positive.
Date posted:
November 14, 2019
.
Answers (1)
-
Draw a triangle ABC such that angle BAC = 90°, AC =5 cm and BC = 10 cm.
i. Circumscribe a circle on the triangle...
(Solved)
Draw a triangle ABC such that angle BAC = 90°, AC =5 cm and BC = 10 cm.
i. Circumscribe a circle on the triangle
ii. Measure the radius of the circle.
iii. Find the difference in the area of the circumcircle and the triangle.
Date posted:
November 14, 2019
.
Answers (1)
-
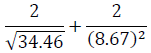
Use square, square root and reciprocal tables only to evaluate the following giving your answer to 2 decimal places.
(Solved)
Use square, square root and reciprocal tables only to evaluate the following giving your answer to 2 decimal places.
Date posted:
November 14, 2019
.
Answers (1)
-
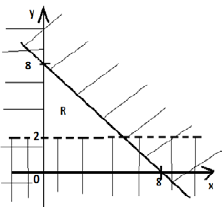
Form three inequalities that satisfy the unshaded region R.
(Solved)
Form three inequalities that satisfy the unshaded region R.
Date posted:
November 14, 2019
.
Answers (1)
-
Find an estimate of the area enclosed by the curve y = x3 – 5, the x – axis and the lines x = 3 x = 4 and x = 6 using the trapezium rule with 3 strips.
(Solved)
Find an estimate of the area enclosed by the curve y = x3 – 5, the x – axis and the lines x = 3 x = 4 and x = 6 using the trapezium rule with 3 strips.
Date posted:
November 14, 2019
.
Answers (1)
-
A salesman is paid a commission of 10% on all sales worth K£ 10,000 and below and a commission of 15% on sales above K£...
(Solved)
A salesman is paid a commission of 10% on all sales worth K£ 10,000 and below and a commission of 15% on sales above K£ 10,000. In one month she got Ksh 50,000 as commission, calculate the total worth of goods in Ksh sold in that month.
Date posted:
November 14, 2019
.
Answers (1)
-
Solve the equation 643x-1 ÷ 16x+2 = 256x × 42x.
(Solved)
Solve the equation 643x-1 ÷ 16x+2 = 256x × 42x.
Date posted:
November 14, 2019
.
Answers (1)
-
Three teachers James, John and Aggrey agreed contribute money to buy a plot. James contributed 1/5 of the total money, John contributed 2/5 of 3/5...
(Solved)
Three teachers James, John and Aggrey agreed contribute money to buy a plot. James contributed 1/5 of the total money, John contributed 2/5 of 3/5 of the total money. Aggrey contributed 1/4 of what James had contributed. If the total sum contributed by Aggrey and John was Ksh.87, 000. Find the amount needed to buy the plot.
Date posted:
November 14, 2019
.
Answers (1)
-
Makau,Wanjiru and Kemboi start a race at 9.03 a.m in the same direction to run round a circular Course. Makau makes the circuit in 252...
(Solved)
Makau,Wanjiru and Kemboi start a race at 9.03 a.m in the same direction to run round a circular Course. Makau makes the circuit in 252 seconds, Wanjiru in 308 seconds and Kemboi in 198 seconds. If they start from the same point, at what time will they next be all at the starting point together?
Date posted:
November 14, 2019
.
Answers (1)
-
The figure below is a cuboid ABCDEFGH such that AB = 8cm, BC = 6cm and CF 5cm.
Determine
(a) the length
(i) AC
(ii) AF
(b)...
(Solved)
The figure below is a cuboid ABCDEFGH such that AB = 8cm, BC = 6cm and CF 5cm.
Determine
(a) the length
(i) AC
(ii) AF
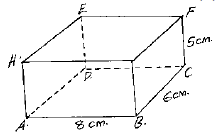
(b) The angle AF makes with the plane ABCD.
(c) The angle AEFB makes with the base ABCD.
Date posted:
November 14, 2019
.
Answers (1)
-
A bag contains 3 red, 5 white and 4 blue balls. Two balls are picked without replacement. Determine the probability of picking.
(a) 2 red balls...
(Solved)
A bag contains 3 red, 5 white and 4 blue balls. Two balls are picked without replacement. Determine the probability of picking.
(a) 2 red balls
(b) Only one red ball
(c) At least a white ball
(d) Balls of same colour.
Date posted:
November 14, 2019
.
Answers (1)