-
The figure below shows a pulley system being used to raise a load.
(Solved)
The figure below shows a pulley system being used to raise a load.
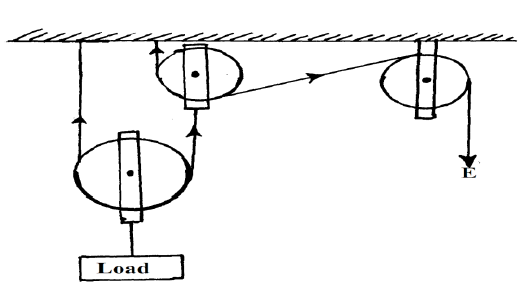
This pulley system has an efficiency of 75%.
(i) Determine the velocity ratio of the system.
(ii) Determine the mechanical advantage of the pulley system.
(iii) Determine the effort required to raise a load of 240kg.
(iv) Determine the work done by a person using this machine in raising a load of 120kg through a vertical distance of 2.5m
Date posted:
November 22, 2019
.
Answers (1)
-
The figure below shows a plastic egg supported vertically by a stream of air from a pump.
(Solved)
The figure below shows a plastic egg supported vertically by a stream of air from a pump.
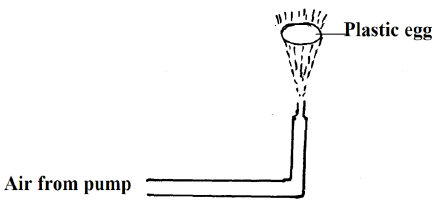
Explain why the egg will not move away from the midstream position.
Date posted:
November 22, 2019
.
Answers (1)
-
Three identical springs each of weight 1.5N are arranged to support a 50N load as shown in the figure below:
(Solved)
Three identical springs each of weight 1.5N are arranged to support a 50N load as shown in the figure below:
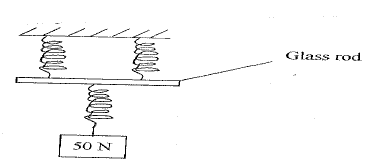
a) Given that one such a spring extends by 2 cm when a load of 20N hangs on its lower end, determine its spring constant.
b) If the glass rod weighs 0.5N, determine the total extension of the system of springs.
Date posted:
November 22, 2019
.
Answers (1)
-
The figure below shows two corks X and Y fixed on a polished plate and a dark plate with candle wax.
(Solved)
The figure below shows two corks X and Y fixed on a polished plate and a dark plate with candle wax.
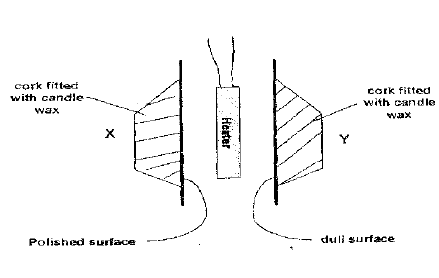
Explain the observation made, when the heater is switched on for a short time interval.
Date posted:
November 22, 2019
.
Answers (1)
-
The figure below shows a micrometer screw gauge holding a ball bearing. Use the figure to answer questions (i) and (ii)
(Solved)
The figure below shows a micrometer screw gauge holding a ball bearing. Use the figure to answer questions (i) and (ii)
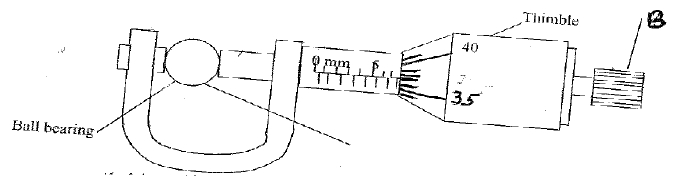
i) State the function of the part labeled B in measuring the dimension of the ball bearing
ii) Determine the radius of the ball bearing in S.I. units.
Date posted:
November 22, 2019
.
Answers (1)
-
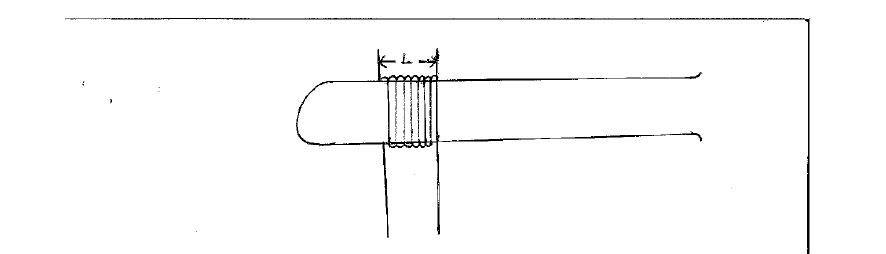
Figure 1 shows a wire wound closely on a test tube. Given that L = 12 mm, determine the thickness of the wire.
(Solved)
Figure 1 shows a wire wound closely on a test tube. Given that L = 12 mm, determine the thickness of the wire.
Date posted:
November 22, 2019
.
Answers (1)
-
A bullet of mass 20 g moving at 400 m/s strikes a block of wood of mass 3.5kg initially at rest. The bullet sticks into...
(Solved)
A bullet of mass 20 g moving at 400 m/s strikes a block of wood of mass 3.5kg initially at rest. The bullet sticks into the block and the two move off together on a horizontal surface, where a frictional retarding force of 4N is acting between the block and surface.
(i) Determine the initial common velocity of bullet and wooden block.
(ii) What distance does the block move before coming to rest?
Date posted:
November 13, 2019
.
Answers (1)
-
The figure below shows a body of mass;??=200?? attached to the centre of a rotating table with a string. The radius of the string was...
(Solved)
The figure below shows a body of mass;𝑚=200𝑔 attached to the centre of a rotating table with a string. The radius of the string was varied and different values of angular velocity recorded. The mass of the body remained constant throughout the experiment
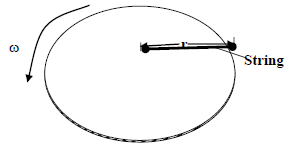
The results obtained for angular velocity and radius were used to plot the following graph;
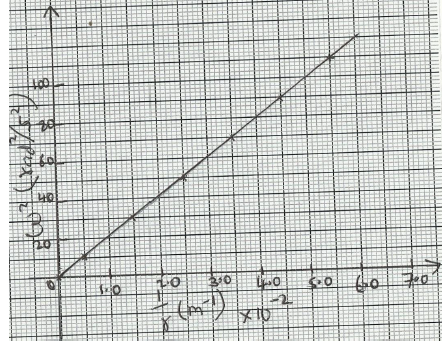
From the above graph;
(i) Calculate the value of the slope

(iii)State the significance of P.
Date posted:
November 13, 2019
.
Answers (1)
-
An object weighs 1.04N in air, 0.64N when fully immersed in water and 0.72N when fully immersed in a liquid. If the density of water...
(Solved)
An object weighs 1.04N in air, 0.64N when fully immersed in water and 0.72N when fully immersed in a liquid. If the density of water is 1000 kgm-3, find the density of the liquid.
Date posted:
November 13, 2019
.
Answers (1)
-
The figure below shows a Bunsen burner.
(Solved)
The figure below shows a Bunsen burner.
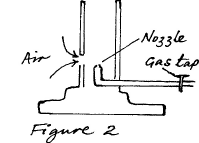
Use the Bernoulli’s Principle to explain how air is drawn into the burner when the gas tap opened.
Date posted:
November 13, 2019
.
Answers (1)
-
A car is brought to rest from a speed of 30m/s in 2 seconds. If the driver’s reaction time is 0.3s, determine the shortest stopping...
(Solved)
A car is brought to rest from a speed of 30m/s in 2 seconds. If the driver’s reaction time is 0.3s, determine the shortest stopping distance.
Date posted:
November 13, 2019
.
Answers (1)
-
The spiral springs shows in the figure below are identical. Each spring has a spring constant K = 300N/m .Each rod weighs 0.1N and each...
(Solved)
The spiral springs shows in the figure below are identical. Each spring has a spring constant K = 300 N/m .Each rod weighs 0.1 N and each spring weighs 0.2 N.
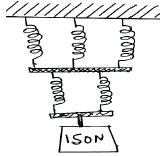
(a) Determine the total extension caused by the 150 N weight.
(b) Apart from length of the spring and nature of material, state one other factor affecting the spring constant.
Date posted:
November 13, 2019
.
Answers (1)
-
The figure below shows a glass tumbler partly filled with water at room temperature.
(Solved)
The figure below shows a glass tumbler partly filled with water at room temperature.
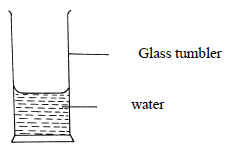
Briefly explain what happens to the stability of the tumbler when water is cooled to temperatures below 0 degrees C.
Date posted:
November 13, 2019
.
Answers (1)
-
The pattern below shows oil leakage on a path at the rate of 10 drops per second form a lorry
(Solved)
The pattern below shows oil leakage on a path at the rate of 10 drops per second form a lorry
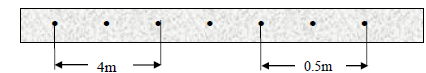
Calculate the acceleration of the lorry.
Date posted:
November 13, 2019
.
Answers (1)
-
The figure below shows a clinical thermometer.
(Solved)
The figure below shows a clinical thermometer.
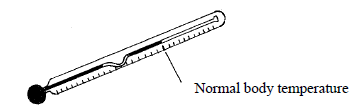
State the function of the constriction.
Date posted:
November 13, 2019
.
Answers (1)
-
n an experiment to estimate the size of a molecule of olive oil, a drop of oil of volume 0.12cm3 was placed on a clean...
(Solved)
In an experiment to estimate the size of a molecule of olive oil, a drop of oil of volume 0.12cm3 was placed on a clean water surface. The oil spread on a patch of
diameter 6.0 x 106 mm2.
a) Calculate the size of the molecule.
b) State an assumption made in the above calculations.
Date posted:
November 13, 2019
.
Answers (1)
-
The diagram below shows the behaviour of mercury in a capillary tube.
(Solved)
The diagram below shows the behaviour of mercury in a capillary tube.
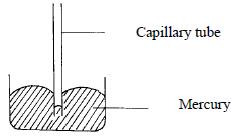
Explain the behaviour.
Date posted:
November 13, 2019
.
Answers (1)
-
The figure below shows a vernier calipers scale.
(Solved)
The figure below shows a vernier calipers scale.
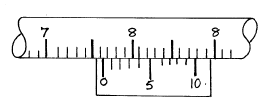
State the correct reading of scale if the instrument has a zero-error of -0.02cm
Date posted:
November 13, 2019
.
Answers (1)
-
student obtained ice at 0 degrees C from a refrigerator and placed it in a beaker on a bench. After 4 minutes, the temperature rose...
(Solved)
student obtained ice at 0 degrees Cfrom a refrigerator and placed it in a beaker on a bench. After 4 minutes, the temperature rose to 4 degrees C. State the changes that would be observed in the water in terms of;
(i) density
(ii) mass
(ii) volume
Date posted:
November 7, 2019
.
Answers (1)
-
The minimum frequency of light that causes photoelectric emission from a metal surface is 6.4 x 10¹⁴Hz . When the surface is irradiated with a...
(Solved)
The minimum frequency of light that causes photoelectric emission from a metal surface is 6.4 x 10¹⁴Hz . When the surface is irradiated with a certain source , electrons are dislodged With a speed of 7.2 x 10⁵m/s.Given that h = 6.63 x 10⁻³⁴Js and m = 9.11 x 10⁻³¹kg , calculate
i) The work function of the metal
ii) The maximum kinetic energy of the photoelectrons
Date posted:
November 4, 2019
.
Answers (1)