-
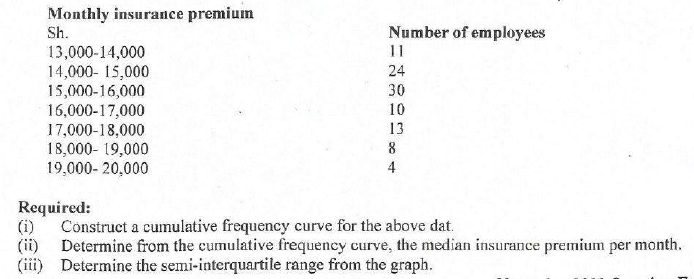
The following data shows monthly insurance premiums paid by a certain class of employees in an organization.
(Solved)
The following data shows monthly insurance premiums paid by a certain class of employees in an organization.
Date posted:
May 26, 2021
.
Answers (1)
-
Differentiate between the following terms as used in statistics.
i) Quantitative data and qualitative data
ii) Descriptive statistics and inferential statistics
(Solved)
Differentiate between the following terms as used in statistics.
i) Quantitative data and qualitative data
ii) Descriptive statistics and inferential statistics
Date posted:
May 26, 2021
.
Answers (1)
-
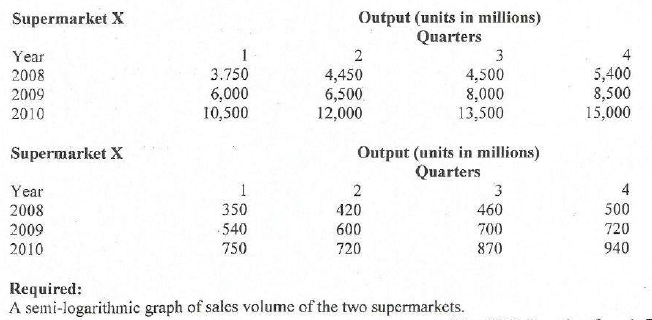
The table below shows the output in units of two supermarkets X and y. The sales volume has been recorded over a period of three...
(Solved)
The table below shows the output in units of two supermarkets X and y. The sales volume has been recorded over a period of three years on a quarterly basis for purposes of comparing the rate of growth of the two supermarkets.
Date posted:
May 26, 2021
.
Answers (1)
-
Outline 2 advantages and 2 disadvantages of using secondary data.
(Solved)
Outline 2 advantages and 2 disadvantages of using secondary data.
Date posted:
May 26, 2021
.
Answers (1)
-
List 5 factors that could be considered in the design of a questionnaire.
(Solved)
List 5 factors that could be considered in the design of a questionnaire.
Date posted:
May 26, 2021
.
Answers (1)
-
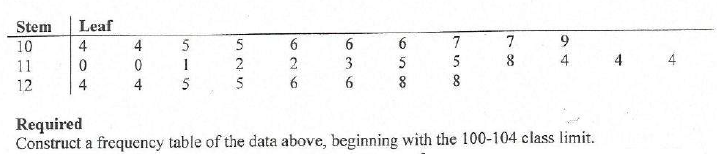
The data below shows the number of units sold by XYZ limited for a 30 day period.
(Solved)
The data below shows the number of units sold by XYZ limited for a 30 day period.
Date posted:
May 26, 2021
.
Answers (1)
-
Outline 2 advantages of representing data using a stem and leaf display.
(Solved)
Outline 2 advantages of representing data using a stem and leaf display.
Date posted:
May 26, 2021
.
Answers (1)
-
Highlight 5 reasons why a sample survey is preferred over a census survey.
(Solved)
Highlight 5 reasons why a sample survey is preferred over a census survey.
Date posted:
May 26, 2021
.
Answers (1)
-
Briefly explain the term "stratified sampling".
(Solved)
Briefly explain the term "stratified sampling".
Date posted:
May 26, 2021
.
Answers (1)
-
Highlight 6 rules of constructing statistical tables.
(Solved)
Highlight 6 rules of constructing statistical tables.
Date posted:
May 26, 2021
.
Answers (1)
-
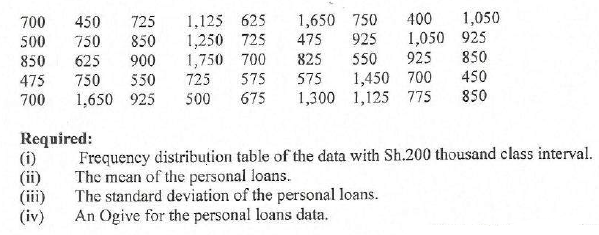
The following data shows the amount of unsecured personal loans in thousands of shillings from a commercial bank.
(Solved)
The following data shows the amount of unsecured personal loans in thousands of shillings from a commercial bank.
Date posted:
May 26, 2021
.
Answers (1)
-
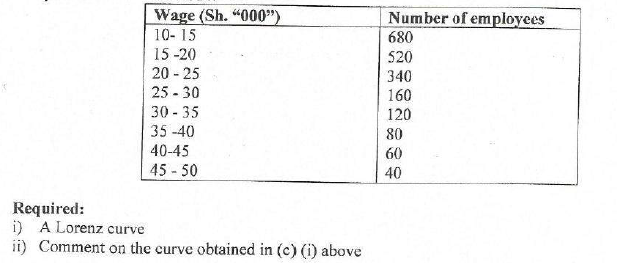
The data below shoes the distribution of wages earned by employees in a certain company for the year ended 30 June 2014.
(Solved)
The data below shoes the distribution of wages earned by employees in a certain company for the year ended 30 June 2014.
Date posted:
May 26, 2021
.
Answers (1)
-
Highlight 4 principles that should be observed when constructing graphs.
(Solved)
Highlight 4 principles that should be observed when constructing graphs.
Date posted:
May 26, 2021
.
Answers (1)
-
Highlight 4 types of biases that could be encountered by a researcher during data collection.
(Solved)
Highlight 4 types of biases that could be encountered by a researcher during data collection.
Date posted:
May 26, 2021
.
Answers (1)
-
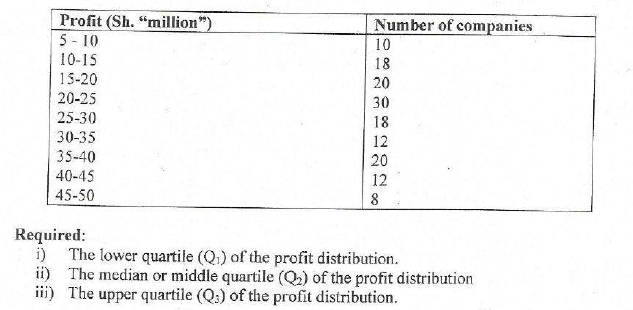
The following table shows the profit distribution of 150 companies in a given county:
(Solved)
The following table shows the profit distribution of 150 companies in a given county:
Date posted:
May 26, 2021
.
Answers (1)
-
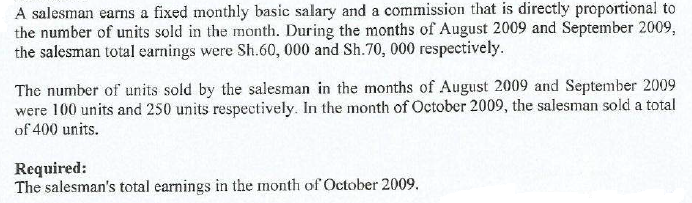
A salesman earns a fixed monthly basic salary and a commission that is directly proportional to the number of units sold in the month.
(Solved)
Date posted:
May 26, 2021
.
Answers (1)
-
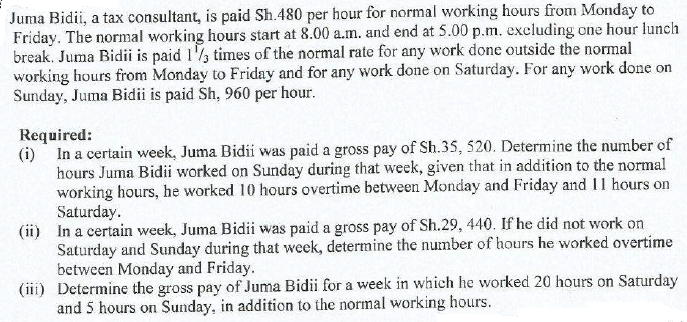
Juma Bidii, a tax consultant, is paid sh 480 per hour for normal working hours from Monday to Friday.
(Solved)
Date posted:
May 26, 2021
.
Answers (1)
-
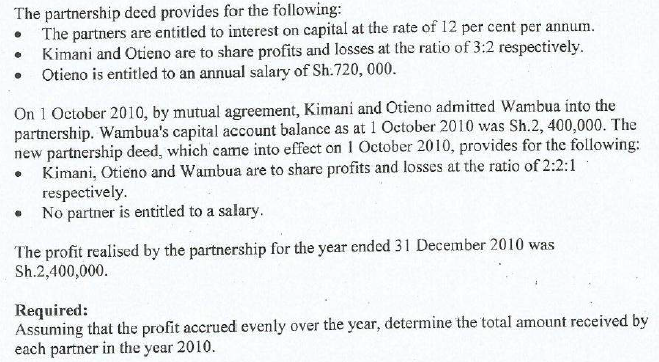
Kimani and Otieno have been trading in partnership since 1 January 2010. The partners' capital account balances as at 1 Jan 2010 were sh 4,500,000...
(Solved)
Kimani and Otieno have been trading in partnership since 1 January 2010. The partners' capital account balances as at 1 Jan 2010 were sh 4,500,000 and sh 3,600,000 respectively.
Date posted:
May 26, 2021
.
Answers (1)
-
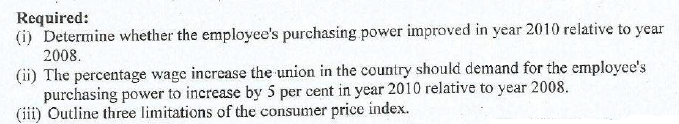
The consumer price indices of a certain country for the years 2008 and 2010, using the year 2000 as the base year were 120 and...
(Solved)
The consumer price indices of a certain country for the years 2008 and 2010, using the year 2000 as the base year were 120 and 128 respectively.
The average wages of a unionisable employee in the country for the years 2008 and 2010 were sh 15,000 and 15,900 respectively.
Date posted:
May 26, 2021
.
Answers (1)
-
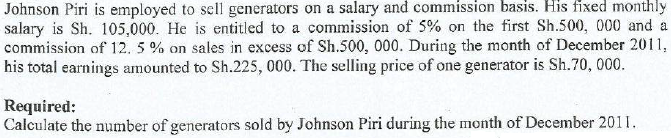
Johnson Piri is employed to sell generators on a salary and commission basis. His fixed monthly salary is sh 105,000.
(Solved)
Date posted:
May 26, 2021
.
Answers (1)