-
State and explain the limitations of ratio analysis.
(Solved)
State and explain the limitations of ratio analysis.
Date posted:
November 8, 2021
.
Answers (1)
-
State and explain the advantages of ratio analysis.
(Solved)
State and explain the advantages of ratio analysis.
Date posted:
November 8, 2021
.
Answers (1)
-
What are the bases used in ratio analysis?
(Solved)
What are the bases used in ratio analysis?
Date posted:
November 8, 2021
.
Answers (1)
-
Name five broad categories of ratio analysis.
(Solved)
Name five broad categories of ratio analysis.
Date posted:
November 8, 2021
.
Answers (1)
-
A company expects to earn a rate of return of 10% on its investment of sh 11,000 after one year. How much does it need...
(Solved)
A company expects to earn a rate of return of 10% on its investment of sh 11,000 after one year. How much does it need to invest now to attain the above returns?
Date posted:
November 8, 2021
.
Answers (1)
-
Find the compound amount, which would be obtained from a principal of sh 2000 at 8% compounded quarterly for 5 years.
(Solved)
Find the compound amount, which would be obtained from a principal of sh 2000 at 8% compounded quarterly for 5 years.
Date posted:
November 8, 2021
.
Answers (1)
-
If you borrowed sh 10,000 for 3 years at 5% simple annual interest, how much will you have paid by the end of three years?
(Solved)
If you borrowed sh 10,000 for 3 years at 5% simple annual interest, how much will you have paid by the end of three years?
Date posted:
November 8, 2021
.
Answers (1)
-
Discuss the various measures of risk.
(Solved)
Discuss the various measures of risk.
Date posted:
November 8, 2021
.
Answers (1)
-
State and explain the factors influencing the required rate of return.
(Solved)
State and explain the factors influencing the required rate of return.
Date posted:
November 8, 2021
.
Answers (1)
-
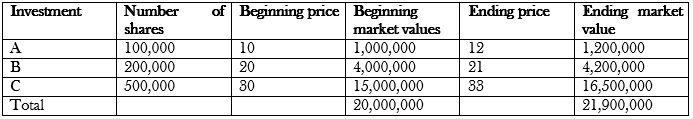
A portfolio of investments consists of the following individual investments and their market values;
Required
Calculate the weighted HPY of the portfolio of investment
(Solved)
A portfolio of investments consists of the following individual investments and their market values;
Required
Calculate the weighted HPY of the portfolio of investment
Date posted:
November 8, 2021
.
Answers (1)
-
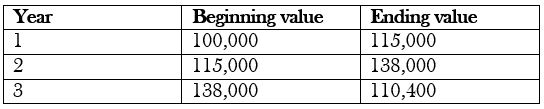
The data below relates to an investment;
Required
Calculate
1. Arithmetic mean (AM)
2. Geometric mean(GM)
(Solved)
The data below relates to an investment;
Required
Calculate
1. Arithmetic mean (AM)
2. Geometric mean(GM)
Date posted:
November 8, 2021
.
Answers (1)
-
An investment costs sh 250,000 and its worth sh 350,000 after being held for two years. Calculate;
1. HPR
2. HPY
3. Annual HPR
4. Annual HPY
(Solved)
An investment costs sh 250,000 and its worth sh 350,000 after being held for two years. Calculate;
1. HPR
2. HPY
3. Annual HPR
4. Annual HPY
Date posted:
November 8, 2021
.
Answers (1)
-
Outline the methods used in carrying out risk analysis.
(Solved)
Outline the methods used in carrying out risk analysis.
Date posted:
November 8, 2021
.
Answers (1)
-
State and explain the different types of long term financing.
(Solved)
State and explain the different types of long term financing.
Date posted:
November 8, 2021
.
Answers (1)
-
State the disadvantages of using preference share capital.
(Solved)
State the disadvantages of using preference share capital.
Date posted:
November 8, 2021
.
Answers (1)
-
State the advantages of using preference share capital.
(Solved)
State the advantages of using preference share capital.
Date posted:
November 8, 2021
.
Answers (1)
-
Outline the classification of preference shares.
(Solved)
Outline the classification of preference shares.
Date posted:
November 8, 2021
.
Answers (1)
-
Outline the factors influencing choice of finance.
(Solved)
Outline the factors influencing choice of finance.
Date posted:
November 8, 2021
.
Answers (1)
-
State the advantages of share capital as a type long term financing.
(Solved)
State the advantages of share capital as a type long term financing.
Date posted:
November 8, 2021
.
Answers (1)
-
State the disadvantages of venture capital as a type long term financing.
(Solved)
State the disadvantages of venture capital as a type long term financing.
Date posted:
November 8, 2021
.
Answers (1)