i) Put soil in water in a beaker. To the mixture add a universal indicator and compare the colour change to the pH chart
OR
Add distilled water to the soil sample and stir. Add 2 drops of universal indicator to the
mixture and compare with the PH chart
ii) Addition of nitrogenous fertilizers which are acidic
OR
- Extensive use of acidic fertilizers
- Pollution by acid rain.
johnmulu answered the question on April 21, 2017 at 12:44
-
The set-up below was used to demonstrate the effect of heat on hard water
(Solved)
The set-up below was used to demonstrate the effect of heat on hard water
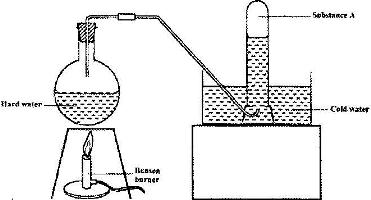
a) Name substance A.
b) Explain why the heating of hard water produced substance A.
Date posted:
April 21, 2017
.
Answers (1)
-
The flow chart below shows the various stages of water treatment. Study it and answer the questions that follow.
(Solved)
The flow chart below shows the various stages of water treatment. Study it and answer the questions that follow.
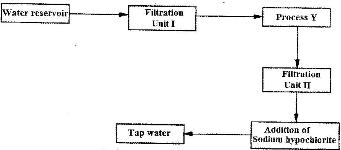
i) Which substance are likely to be removed in filtration unit I?
ii) What is the name of the process Y?
iii) What is the purpose of:
I. Process Y
II. Addition of sodium hypochlorite
Date posted:
April 21, 2017
.
Answers (1)
-
The table below shows the tests carried out on separate samples of water drawn from a well and the results obtained.
(Solved)
The table below shows the tests carried out on separate samples of water drawn from a well and the results obtained.
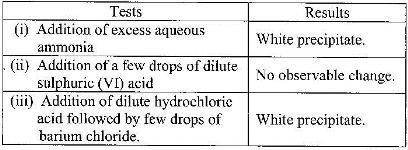
a) Identify the cation and the anion present in the water.
b) Write an ionic equation for the reaction which takes place in test (iii).
Date posted:
April 21, 2017
.
Answers (1)
-
The table below shows the solubility of a salt at various temperatures
(Solved)
The table below shows the solubility of a salt at various temperatures
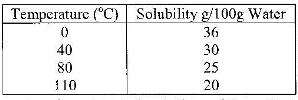
What would happen if a sample of a saturated solution of the salt at 40o C is heated to 80oC.Explain
Date posted:
April 21, 2017
.
Answers (1)
-
Study the flow chart below and answer the questions that follow
(Solved)
Study the flow chart below and answer the questions that follow
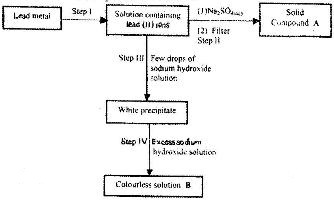
Name:
i) The reagent used in step I
ii) Compound A
Date posted:
April 21, 2017
.
Answers (1)
-
The flow charts below show an analysis of a mixture R that contains two salts. Study the analysis and answer the questions that follow.
(Solved)
The flow charts below show an analysis of a mixture R that contains two salts. Study the analysis and answer the questions that follow.
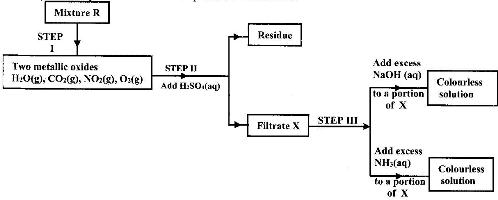
i) What condition is necessary for the process in step I to take place.
ii) Write an ionic equation for the reaction between the cation in filtrate X and aqueous ammonia
iii) What observation would indicate the presence of NO2(g) in step I?
iv) State how water vapour, in step I could be identified.
Date posted:
April 21, 2017
.
Answers (1)
-
In an experiment, soap solution was added to three separate samples of water. The table below shows the volumes of soap solutions required to form lather with 1000cm3 of each sample of water before and after boiling.
(Solved)
In an experiment, soap solution was added to three separate samples of water. The table below shows the volumes of soap solutions required to form lather with 1000cm3 of each sample of water before and after boiling.
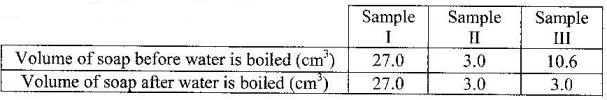
a) Which water sample is likely to be soft? Explain
b) Name the cause of change in the volume of soap solution used in sample III
Date posted:
April 21, 2017
.
Answers (1)
-
The diagram below represents the set-up that was used to prepare and collect hydrogen chloride gas in the laboratory.
(Solved)
The diagram below represents the set-up that was used to prepare and collect hydrogen chloride gas in the laboratory.
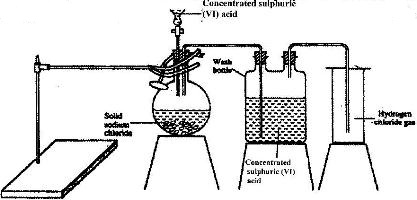
a) State the purpose of concentrated sulphuric (VI) acid in the wash bottle.
b) Write an equation for the reaction between dry hydrogen chloride gas and heated iron
Date posted:
April 21, 2017
.
Answers (1)
-
The diagram below is representation of an industrial process for the manufacture of a bleaching powder.
(Solved)
The diagram below is representation of an industrial process for the manufacture of a bleaching powder.
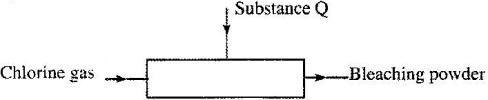
i) Name substance Q.
ii) When the bleaching powder is added to water during washing, a lot of soap is used. Explain.
Date posted:
April 21, 2017
.
Answers (1)
-
The set-up below was used to prepare dry hydrogen chlorine gas, and investigate its effect on the heated iron fillings
(Solved)
The set-up below was used to prepare dry hydrogen chlorine gas, and investigate its effect on the heated iron fillings
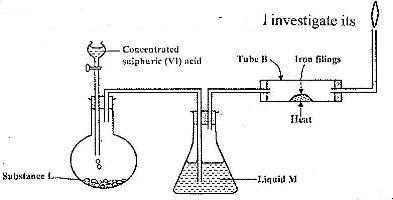
i) Name the substance L.
ii) Name liquid M
iii) What will be observed in tube B?
iv) Why is the gas from tube B burnt?
Date posted:
April 21, 2017
.
Answers (1)
-
A gas jar full of chlorine water was inverted over water and allowed to stand for some time.
a) State and explain two observations made in the gas jar after some times.
(Solved)
A gas jar full of chlorine water was inverted over water and allowed to stand for some time.
a) State and explain two observations made in the gas jar after some times.
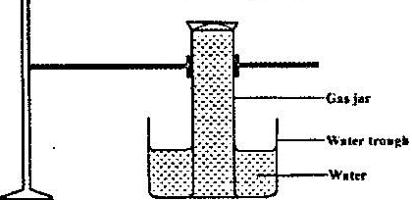
b) Write the equation for the reaction between chlorine and hot concentrated potassium hydroxide
Date posted:
April 21, 2017
.
Answers (1)
-
The diagram below represents a setup for large scale manufacture of hydrochloric acid. Study it and answer the questions that follow
(Solved)
The diagram below represents a setup for large scale manufacture of hydrochloric acid. Study it and answer the questions that follow
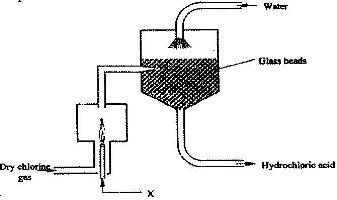
a) Name substance X.
b) What is the purpose of the glass beads?
c) Give two uses of hydrochloric acid
Date posted:
April 21, 2017
.
Answers (1)
-
In an experiment, dry chlorine gas was reacted with aluminium as shown in Figure 1.
(Solved)
In an experiment, dry chlorine gas was reacted with aluminium as shown in Figure 1.
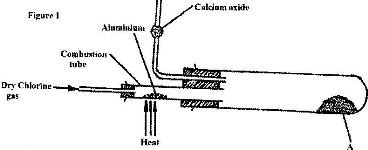
i) Name substance A.
ii) Give two reasons why calcium oxide is used in the set up.
Date posted:
April 20, 2017
.
Answers (1)
-
In an experiment, a test-tube full of chlorine water was inverted in chlorine water as shown in the diagram below and the set up left in sunlight for one day
(Solved)
In an experiment, a test-tube full of chlorine water was inverted in chlorine water as shown in the diagram below and the set up left in sunlight for one day
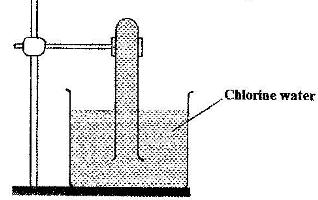
After one day, a gas was found to have collected in the test-tube
a) Identify the gas
b) What will happen to the pH of the solution in the beaker after one day? Give an explanation
Date posted:
April 20, 2017
.
Answers (1)
-
The diagram below represents the set-up that was used to prepare and collect hydrogen chloride gas in the laboratory
(Solved)
The diagram below represents the set-up that was used to prepare and collect hydrogen chloride gas in the laboratory
a)State the purpose of concentrated sulphuric (VI) acid in the wash bottle.
b) Hydrogen chloride gas is dissolved in water to make hydrochloric acid. State one use of hydrochloric acid.
Date posted:
April 20, 2017
.
Answers (1)
-
The set-up below was used to prepare hydrogen chloride gas and react it with iron powder.Study it and answer the questions that follow.
(Solved)
The set-up below was used to prepare hydrogen chloride gas and react it with iron powder.Study it and answer the questions that follow.
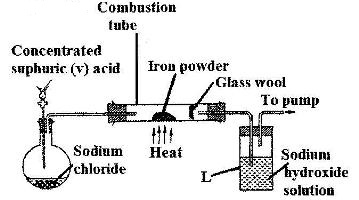
At the end of the reaction, the iron powder turned into a light green solid
a) Identify the light green solid
b) At the beginning of the experiment, the pH of the solution in container L was about 14. At the end, the pH was found to be 2. Explain.
Date posted:
April 20, 2017
.
Answers (1)
-
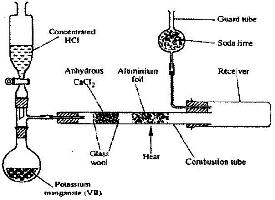
A student set out to prepare iron (III) chlorine using the apparatus shown in the diagram below.
(Solved)
A student set out to prepare iron (III) chlorine using the apparatus shown in the diagram below.
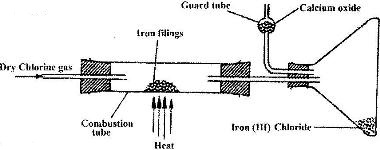
i) Explain why: I. It is necessary to pass chlorine gas through the apparatus before heating begins
II. calcium oxide would be preferred to calcium chloride in the guard tube
ii) What property of iron (III) chloride makes it possible to be collected as shown in the diagram?
Date posted:
April 20, 2017
.
Answers (1)
-
The diagram below shows a set up for the laboratory preparation and collection of dry chlorine gas
(Solved)
The diagram below shows a set up for the laboratory preparation and collection of dry chlorine gas
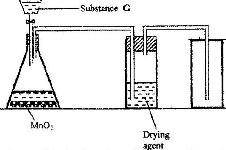
a) Name
i) Substance G
ii) A suitable drying agent
b) What property of chlorine makes it possible for it to be collected as shown in the diagram?
Date posted:
April 20, 2017
.
Answers (1)
-
In an experiment, dry hydrogen chloride gas was passed through heated zinc turnings as shown in the diagram below. The gas produced was then passed through heated lead (II) oxide.
(Solved)
In an experiment, dry hydrogen chloride gas was passed through heated zinc turnings as shown in the diagram below. The gas produced was then passed through heated lead (II) oxide.
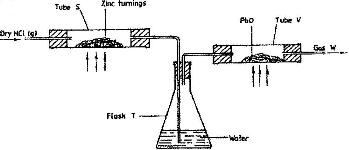
i) What is the function of water in the flask?
ii) How would the total mass of tube V and its contents compare before and after the experiment? Explain.
Date posted:
April 20, 2017
.
Answers (1)
-
In an experiment, chlorine gas was passed into moist hydrogen sulphide in a boiling tube as shown in the diagram.
(Solved)
In an experiment, chlorine gas was passed into moist hydrogen sulphide in a boiling tube as shown in the diagram.
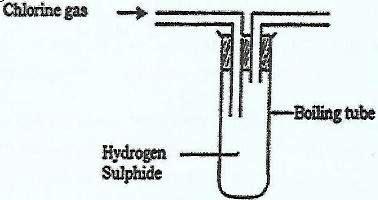
a) What observation was made in the boiling tube?
b) What precaution should be taken in carrying out this experiment? Give a reason.
c) Distinguish between the bleaching action of chlorine and that of sulphur(IV) Oxide.
d) Write an equation of the reaction that took place in the boiling tube
Date posted:
April 20, 2017
.
Answers (1)