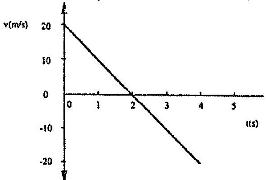
(i) Area under the curve = 2 x 20 + 0.5 x 4 x 20 = 40 + 40m = 80 m
(ii) a = gradient = $\frac{20-0}{10-14}$ = $\frac{20}{-4}$ = - 5m/s2
(iii) F = ma
= 2 x -5m/s2
= - 10 N
johnmulu answered the question on May 15, 2017 at 12:46
-
Figure 2 shows a section of a curved surface ABCD. Point A is higher than Point B while BCD is horizontal. Part ABC is smooth while CD is rough. A mass m is released from rest at A and moves towards D.
(Solved)
Figure 2 shows a section of a curved surface ABCD. Point A is higher than Point B while BCD is horizontal. Part ABC is smooth while CD is rough. A mass m is released from rest at A and moves towards D.
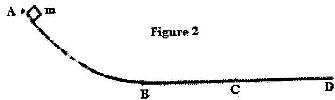
State the changes in the velocity of m between:
(a) B and C;
(b) C and D;
Date posted:
May 15, 2017
.
Answers (1)
-
Figure 9 shows graph of velocity against time for a ball bearing released at the surface of viscous liquid.
(Solved)
Figure 9 shows graph of velocity against time for a ball bearing released at the surface of viscous liquid.
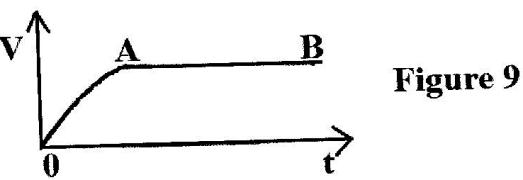
Explain the motion of the ball bearing for parts.
(i) OA
(ii) AB
Date posted:
May 15, 2017
.
Answers (1)
-
Figure 3 shows a graph of velocity against time for a moving body.
(Solved)
Figure 3 shows a graph of velocity against time for a moving body.
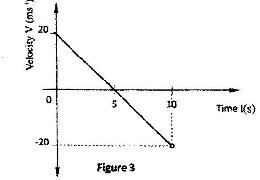
Describe the motion of the body during the 10 seconds
Date posted:
May 15, 2017
.
Answers (1)
-
Figure 9 shows a velocity-time graph for the motion of a certain body.
(Solved)
Figure 9 shows a velocity-time graph for the motion of a certain body.
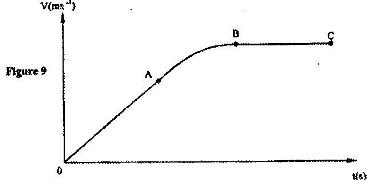
Describe the motion of the body in the region;
(i) OA; (ii) AB; (iii) BC;
Date posted:
May 15, 2017
.
Answers (1)
-
The graph below shows how the velocity varies with time for a body thrown vertically upwards.
(Solved)
The graph below shows how the velocity varies with time for a body thrown vertically upwards.
Determine the total distance moved by the body.
Date posted:
May 15, 2017
.
Answers (1)
-
Figure 9 shows a speed-time graph for the journey of a motor car.
(Solved)
Figure 9 shows a speed-time graph for the journey of a motor car.
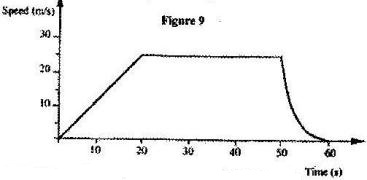
Determine the distance the car travels in the first 40 seconds.
Date posted:
May 15, 2017
.
Answers (1)
-
Figure 5 shows air flowing through a pipe of different cross-sectional areas. Two pipes A and B are dipped into water.
(Solved)
Figure 5 shows air flowing through a pipe of different cross-sectional areas. Two pipes A and B are dipped into water.
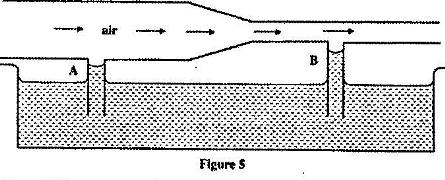
Explain the cause of the difference in the levels of water in the pipes A and B.
Date posted:
May 15, 2017
.
Answers (1)
-
Figure 5 shows a Bunsen burner.
(Solved)
Figure 5 shows a Bunsen burner.
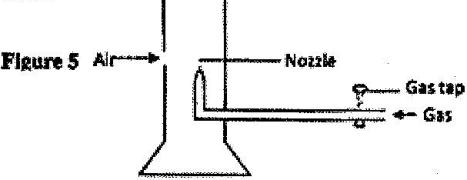
Explain how air is drawn into the burner when the gas tap is opened.
Date posted:
May 15, 2017
.
Answers (1)
-
Figure 5 shows parts A, B and C of a glass tube.
(Solved)
Figure 5 shows parts A, B and C of a glass tube.
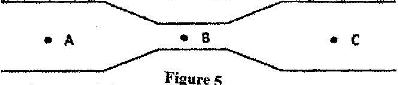
State with a reason the part of the tube in which the pressure will be lowest when air is blown through the tube from A towards C.
Date posted:
May 15, 2017
.
Answers (1)
-
Figure 7 shows part of a petrol engine, in which air flowing under atmospheric pressure passes into a constriction, where it mixes with petrol. The mixture then flows into a combustion cylinder.
(Solved)
Figure 7 shows part of a petrol engine, in which air flowing under atmospheric pressure passes into a constriction, where it mixes with petrol. The mixture then flows into a combustion cylinder.
Explain what causes the petrol to move from the petrol chamber to the air steam in the constriction when the piston is moved downwards.
Date posted:
May 15, 2017
.
Answers (1)
-
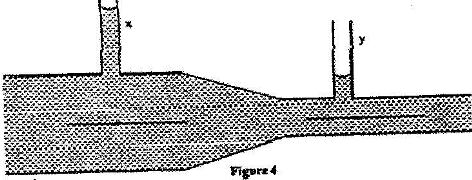
Figure 4 shows a horizontal tube with two vertical tubes x and y. Water flows through the horizontal tube from right to left. The water level in the tube x is higher than water level in tube y
(Solved)
Figure 4 shows a horizontal tube with two vertical tubes x and y. Water flows through the horizontal tube from right to left. The water level in the tube x is higher than water level in tube y
Explain this observation.
Date posted:
May 15, 2017
.
Answers (1)
-
Figure 6 shows two inflated balloons hanging vertically on light threads.
(Solved)
Figure 6 shows two inflated balloons hanging vertically on light threads.
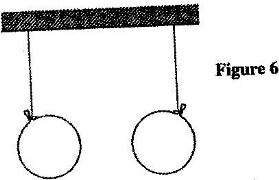
When a stream of air is blown in the space between the balloons, they are observed to move towards each other. Explain this observation
Date posted:
May 15, 2017
.
Answers (1)
-
Figure 6 shows a sheet of paper rolled into a tube
(Solved)
Figure 6 shows a sheet of paper rolled into a tube
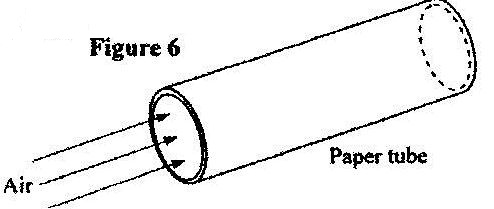
When a fast stream of air is blown into the tube as shown in the diagram the paper tube collapses. Explain the observation.
Date posted:
May 15, 2017
.
Answers (1)
-
Figure 2 shows a tube of varying cross sectional area. V1, V2, V3 and V4 represent the speed of water as it flows steadily through the sections of the tube
(Solved)
Figure 2 shows a tube of varying cross sectional area. V1, V2, V3 and V4 represent the speed of water as it flows steadily through the sections of the tube
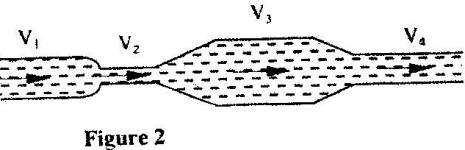
Arrange the speed V1, V2, V3 and V4 in decreasing order starting with the highest
Date posted:
April 19, 2017
.
Answers (1)
-
Figure 19 shows a pith ball placed in a flask. When a jet of air is blown over the mouth of the flask as shown, the pith ball is observed to rise from bottom.
(Solved)
Figure 19 shows a pith ball placed in a flask. When a jet of air is blown over the mouth of the flask as shown, the pith ball is observed to rise from bottom.
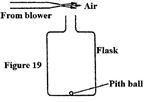
Explain this observation
Date posted:
April 19, 2017
.
Answers (1)
-
A student holds a sheet of paper at one end so that it hangs in the position A as shown in Figure 14
(Solved)
A student holds a sheet of paper at one end so that it hangs in the position A as shown in Figure 14
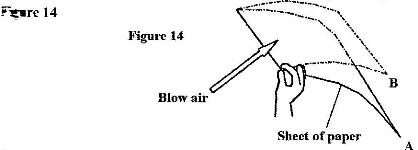
If the cross-sectional area A1 at P is less than A2 at Q, state how the liquid velocity V2 at Q compares with velocity V1 at P.
Date posted:
April 19, 2017
.
Answers (1)
-
Figure 1 shows a section of a pipe PQ. A constant pressure difference maintains a streamline flow of a liquid in the pipe.
(Solved)
Figure 1 shows a section of a pipe PQ. A constant pressure difference maintains a streamline flow of a liquid in the pipe.
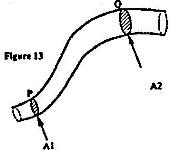
If the cross-section area A1 at P is less than A2 at Q, state how the liquid velocity V2 at Q compares with velocity V1 at P.
Date posted:
April 19, 2017
.
Answers (1)
-
Fig. 9 shows a Bunsen burner.
(Solved)
Fig. 9 shows a Bunsen burner.
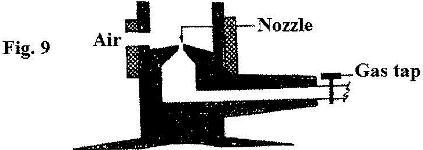
Use Bernoulli's principle to explain how air is drawn into the burner, when, the gas tap is opened.
Date posted:
April 19, 2017
.
Answers (1)
-
Figure 12 shows a displacement - time graph for a progressive wave
(Solved)
Figure 12 shows a displacement - time graph for a progressive wave
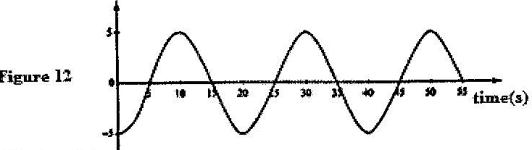
i) State the amplitude of the wave
ii) Determine the frequency of the wave.
Date posted:
April 19, 2017
.
Answers (1)
-
Figure 2 shows how the displacement varies with time for a certain wave
(Solved)
Figure 2 shows how the displacement varies with time for a certain wave
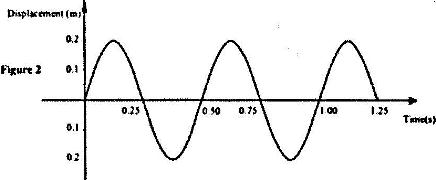
Determine the frequency of the wave.
Date posted:
April 19, 2017
.
Answers (1)