From the graph, half the = $\frac{78}{2}$ = 36 atom time which corresponds to 26 (+or_1) minutes
johnmulu answered the question on June 6, 2017 at 07:13
-
Figure 8 shows ultra-violet light striking a polished zinc plate placed on a negatively charged gold-leaf electroscope.
(Solved)
Figure 8 shows ultra-violet light striking a polished zinc plate placed on a negatively charged gold-leaf electroscope.
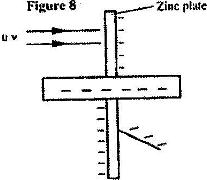
Explain the following observations.
(i) The leaf of the electroscope falls.
(ii) When the same experiment was repeated with a positively charged electroscope the leaf did not fall
Date posted:
June 6, 2017
.
Answers (1)
-
In figure 18 ultra-violet (u.v.) light falls on a zinc plate placed on a charged leaf electroscope. It is observed that the leaf collapses.
(Solved)
In figure 18 ultra-violet (u.v.) light falls on a zinc plate placed on a charged leaf electroscope. It is observed that the leaf collapses.
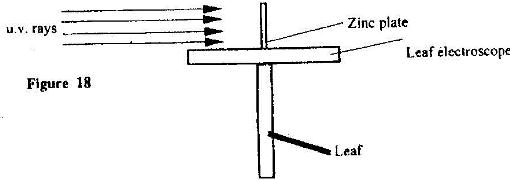
Explain how this observation may be used to determine the type of charge on the electroscope.
Date posted:
June 6, 2017
.
Answers (1)
-
Explain how land and sea breeze occurs
(Solved)
Explain how land and sea breeze occurs.
Date posted:
June 6, 2017
.
Answers (1)
-
Figure 5 shows a narrow beam of x-rays passing between two metal plates in air. The plates are connected in series with a switch, a cell and a milliammeter.
(Solved)
Figure 5 shows a narrow beam of x-rays passing between two metal plates in air. The plates are connected in series with a switch, a cell and a milliammeter
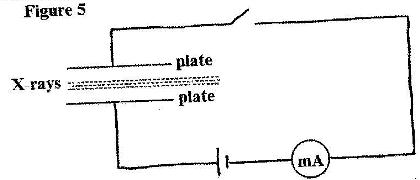
It is observed that when the switch is closed a current flows in the milliammeter. Explain this observation.
Date posted:
June 6, 2017
.
Answers (1)
-
Figure 18 shows the parts of an x-ray tube.
(Solved)
Figure 18 shows the parts of an x-ray tube.
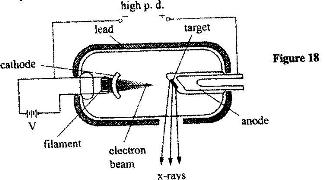
(a) Explain why:
(i) A potential difference is applied to the filament.
(ii) A high potential difference is applied between a cathode and the anode.
(iii) Most of the tube is surrounded by lead.
(b) State how the resulting x -rays are affected by increasing the potential difference between the anode and the cathode.
Date posted:
June 6, 2017
.
Answers (1)
-
Figure 13 shows the features of an X-ray tube.
(Solved)
Figure 13 shows the features of an X-ray tube.
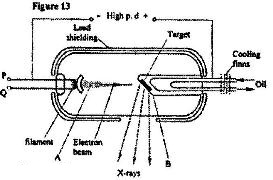
(i) Name the parts labeled A and B.
(ii) Explain how a change in the potential across PQ changes the intensity of the X -rays produced in the tube.
(iii) During the operation of the tube, the target becomes very hot. Explain how this heat is caused.
(iv) What property of lead makes it suitable for use as shielding material?
Date posted:
June 6, 2017
.
Answers (1)
-
Figure 10 shows the waveform of a signal applied at the y - plates of an oscilloscope whose time-base is switched to the scale of 2 milliseconds per centimeter.
(Solved)
Figure 10 shows the waveform of a signal applied at the y - plates of an oscilloscope whose time-base is switched to the scale of 2 milliseconds per centimeter.
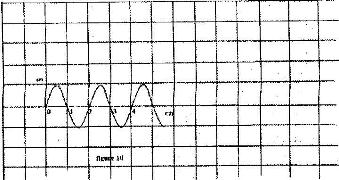
Determine:
(i) The period of the signal;
(ii) The frequency of the signal.
Date posted:
June 6, 2017
.
Answers (1)
-
Figure 9 shows a cathode ray tube in which a beam of electrons is cast on the screen.
(Solved)
Figure 9 shows a cathode ray tube in which a beam of electrons is cast on the screen.
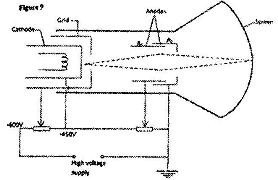
(i) State how electrons are produced in the tube.
(ii) state how electron beam is detected.
(iii) State the reason for having a variable potential difference (p.d) at the: (I) grid (II) anodes
Date posted:
June 6, 2017
.
Answers (1)
-
Figure 10 shows the main features of a cathode ray oscilloscope (CRO).
(Solved)
Figure 10 shows the main features of a cathode ray oscilloscope (CRO).
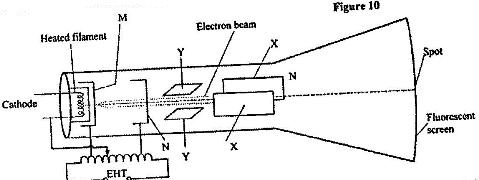
(i) Name the part labeled M and N.
(ii) Explain how electrons are produced in the tube.
(iii) State why the tube is highly evacuated.
Date posted:
June 6, 2017
.
Answers (1)
-
Figure 14 (a) is a diagram of a cathode ray tube. M and N are parallel vertical plates.
(Solved)
Figure 14 (a) is a diagram of a cathode ray tube. M and N are parallel vertical plates.
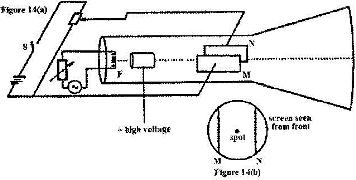
When switch S is open, a spot is seen at the centre of the screen as shown in Figure 14
(i) State what happens to the sport when S is closed.
(ii) State what would happen to the spot if the potential difference across MN is increased
Date posted:
June 6, 2017
.
Answers (1)
-
Figure 14 shows the features of a cathode ray tube.
(Solved)
Figure 14 shows the features of a cathode ray tube.
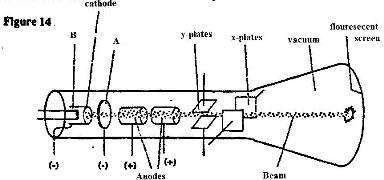
(i) Name the parts labeled A and B.
(ii) Explain how the electrons are produced in the tube.
(iii) State two functions of the anodes.
(iv) At what part of the cathode ray tube would the time be connected?
(v) Why is a vacuum created in the tube?
Date posted:
June 5, 2017
.
Answers (1)
-
Figure 6 shows a tube for investing the properties of a beam of electrons. Use the information in the figure to answer the question.
(Solved)
Figure 6 shows a tube for investing the properties of a beam of electrons. Use the information in the figure to answer the question.
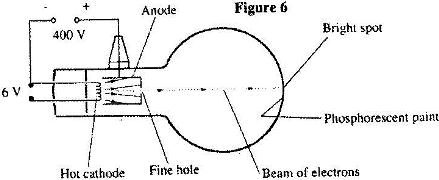
What property of the beam of electrons shows that the electrons are traveling at a very high speed?
Date posted:
June 5, 2017
.
Answers (1)
-
Figure 3 shows the main features of a cathode ray tube (CRT) of a cathode ray oscilloscope (CRO).
(Solved)
Figure 3 shows the main features of a cathode ray tube (CRT) of a cathode ray oscilloscope (CRO).
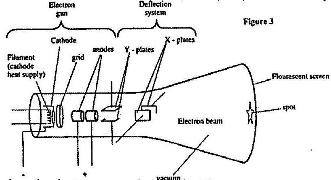
(i) Describe how the electrons are produced in the tube.
(ii) State and explain the function of the grid.
(iii) State what would be observed on the screen if an a.c voltage is connected across the y-plates.
Date posted:
June 5, 2017
.
Answers (1)
-
Figure 12 shows a section of a house wiring system.
(Solved)
Figure 12 shows a section of a house wiring system.
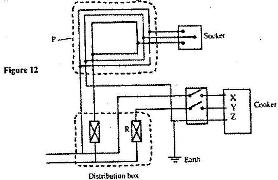
(i) Name:
the circuit labeled P.
the terminals labeled X and Y.
(ii) I. State the purpose of R in the circuit.
II. Give a reason why R is connected to Y but not to X.
(iii) Why is the earthing necessary in such a circuit?
Date posted:
June 5, 2017
.
Answers (1)
-
Figure 17 shows the electric wiring of an electric heater. A, B, C are the mains wires.
(Solved)
Figure 17 shows the electric wiring of an electric heater. A, B, C are the mains wires.
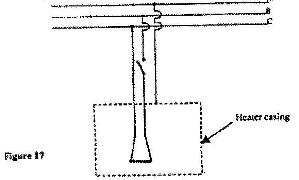
Identify A, B and C.
Date posted:
June 5, 2017
.
Answers (1)
-
Figure 4 shows a simple transformer connected to a 12 V a.c source and an a.c voltmeter.
(Solved)
Figure 4 shows a simple transformer connected to a 12 V a.c source and an a.c voltmeter.
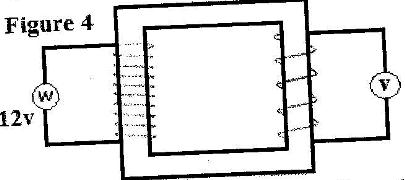
By counting the number of turns in each coil, determine the reading on the voltmeter.
Date posted:
June 5, 2017
.
Answers (1)
-
Figure 15, shows two coils A and B placed close to each other. A is connected to a steady D.C. Supply and a switch, B is connected to a sensitive galvanometer.
(Solved)
Figure 15, shows two coils A and B placed close to each other. A is connected to a steady D.C. Supply and a switch, B is connected to a sensitive galvanometer.
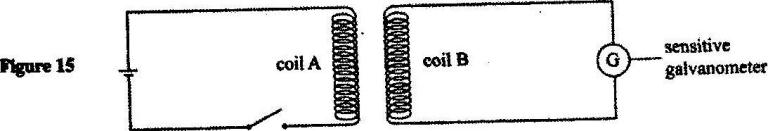
(i) The switch is now closed. State the observations made on the galvanometer.
(ii) Explain what would be observed if the switch is then open.
Date posted:
June 5, 2017
.
Answers (1)
-
Figure 6 shows a horizontal conductor in a magnetic field parallel to the plane of the paper.
(Solved)
Figure 6 shows a horizontal conductor in a magnetic field parallel to the plane of the paper.
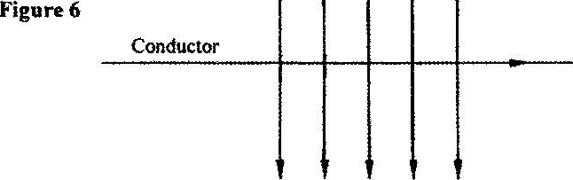
State the direction in which the wire may be moved so that the induced current is in the direction shown by the arrow.
Date posted:
June 5, 2017
.
Answers (1)
-
Figure 5 shows a magnet being moved towards a stationary solenoid. It is observed that a current flows through the circuit in a direction Q to P.
(Solved)
Figure 5 shows a magnet being moved towards a stationary solenoid. It is observed that a current flows through the circuit in a direction Q to P.
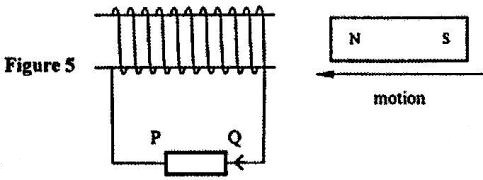
Explain: (i) How the current is produced
(ii) Why the current flows from Q to P.
Date posted:
June 5, 2017
.
Answers (1)
-
Figure 12 shows two circuits close to each other.
(Solved)
Figure 12 shows two circuits close to each other.
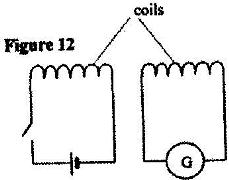
When the switch is closed, the galvanometer shows a reading and then returns to zero. When the switch is then opened, the galvanometer shows a reading in the opposite direction and then returns to zero. Explain these observations.
Date posted:
June 5, 2017
.
Answers (1)