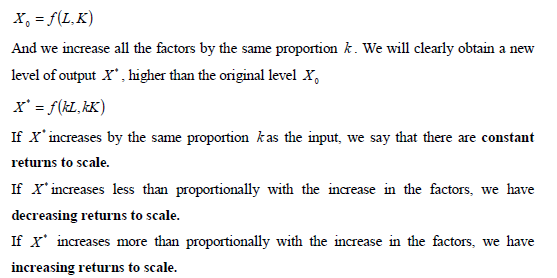
This is a long-term analysis of production it shows by how much total output will change as a result of a change in all factor inputs by same proportion.
Suppose we start from an initial level of input and output.
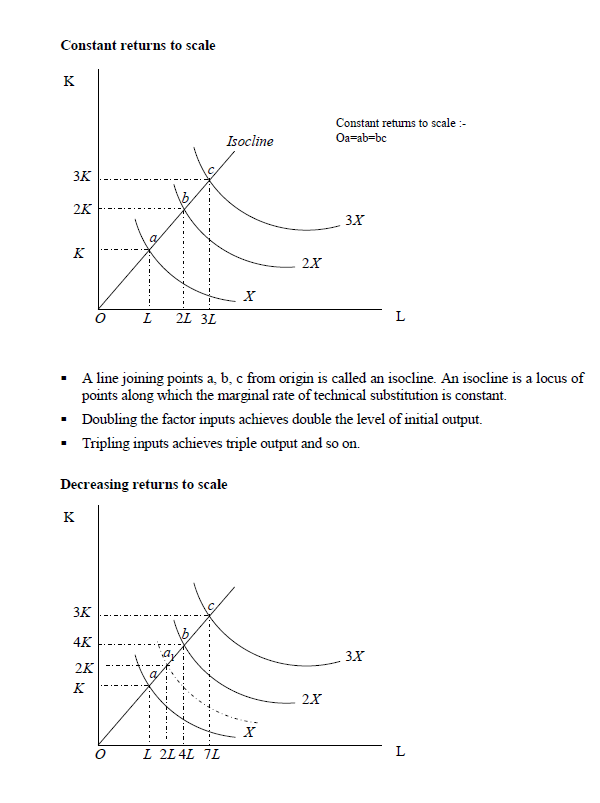
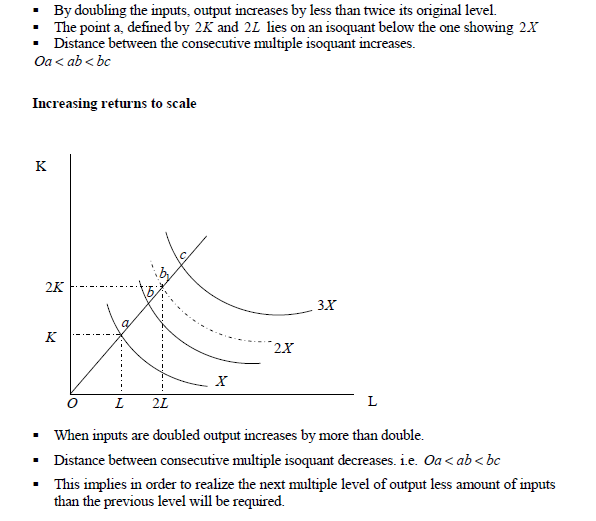
GRAPHICAL PRESENTATION OF THE RETURNS TO SCALE
Returns to scale may be shown graphically by the distance between successive, multiplelevel- of-output isoquant, that is, isoquant that show levels of output which are multiples of same base level of output, e.g. X ,2X ,3X etc.
Wilfykil answered the question on
March 7, 2019 at 05:34