i)Region A – shows ice becoming warm from below 00C.
B – shows that the temperature remains 00C as all the ice melts
C – shows water becoming hotter from 00C to 1000C when it begins to boil.
D – shows water boiling and the temperature remains constant.
ii)In B and D regions, the heat supplied is being used to bring about the change in structure from one physical state to another and so the temperature does not rise.
Kavungya answered the question on March 25, 2019 at 08:06
-
Where in Kenya is Crystallization method used? State what happens briefly.
(Solved)
Where in Kenya is Crystallization method used? State what happens briefly.
Date posted:
March 25, 2019
.
Answers (1)
-
When fine chalk is suspended in water and viewed through a microscope the chalk particles appear to move in a random fashion. This motion is...
(Solved)
When fine chalk is suspended in water and viewed through a microscope the chalk particles appear to move in a random fashion. This motion is a result of?
Date posted:
March 25, 2019
.
Answers (1)
-
State how chromatography is applied in real life situation.
(Solved)
State how chromatography is applied in real life situation.
Date posted:
March 25, 2019
.
Answers (1)
-
What do you understand by solvent extraction in separation of mixtures?
(Solved)
What do you understand by solvent extraction in separation of mixtures?
Date posted:
March 25, 2019
.
Answers (1)
-
What do impurities do to both Boiling points and melting points of substances?
(Solved)
What do impurities do to both Boiling points and melting points of substances?
Date posted:
March 25, 2019
.
Answers (1)
-
What method can be used to obtain pure crystals from a soluble solid with impurities?
(Solved)
What method can be used to obtain pure crystals from a soluble solid with impurities?
Date posted:
March 25, 2019
.
Answers (1)
-
Name
(a) Cleansing agents for removing these stains from your school dress:
(i) Oily and greasy –
(ii) Blood stains –...
(Solved)
Name
(a) Cleansing agents for removing these stains from your school dress:
(i) Oily and greasy –
(ii) Blood stains –
(iii) Perspiration stains –
(b) A drying agent for ammonia gas –
(c) A solvent for paint –
(d) A gas which cannot be collected over water –
(e) A solid that sublimes –
Date posted:
March 25, 2019
.
Answers (1)
-
What does distillation mean and what is its importance in chemistry?
(Solved)
What does distillation mean and what is its importance in chemistry?
Date posted:
March 25, 2019
.
Answers (1)
-
Monica a form one student decides to separate powdered calcium carbonate from powdered calcium chloride by shaking the mixture with water and then filtering. Would...
(Solved)
Monica a form one student decides to separate powdered calcium carbonate from powdered calcium chloride by shaking the mixture with water and then filtering. Would this procedure succeed? Explain your answer.
Date posted:
March 25, 2019
.
Answers (1)
-
Against each mixture write down suitable methods of separation.
(a) Coloured extracts of grass dissolved in ethanol.
(b) Kerosine from Crude oil.
(c) Paraffin from water.
(d)...
(Solved)
Against each mixture write down suitable methods of separation.
(a) Coloured extracts of grass dissolved in ethanol.
(b) Kerosine from Crude oil.
(c) Paraffin from water.
(d) Iron filings from Sulphur powder.
(e) Ammonium chloride from Sodium chloride.
(f) Seawater, to obtain salt.
(g) Blue Copper Sulphate crystals from aqueous copper sulphate.
Date posted:
March 25, 2019
.
Answers (1)
-
Why is fractional distillation suitable for separating crude oil constituents?
(Solved)
Why is fractional distillation suitable for separating crude oil constituents?
Date posted:
March 25, 2019
.
Answers (1)
-
Which observation made when helium is ignited in oxygen?
(Solved)
Which observation made when helium is ignited in oxygen?
Date posted:
March 24, 2019
.
Answers (1)
-
The flow chart below shows the various stages of water treatment. Study it and answer the questions that follow.
(Solved)
The flow chart below shows the various stages of water treatment. Study it and answer the questions that follow.
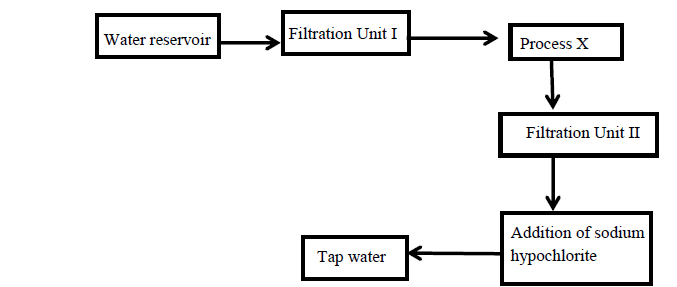
i) What is the purpose of filtration unit I
ii) What is the name of process X
What is the purpose of
I.Process X
II.Addition of sodium hypochlorite
b) A sample of tap water was found to contain magnesium sulphate.
i) What type of hardness was present in the water?
ii) Explain how the hardness can be removed.
c)i) Describe how a solid sample of calcium carbonate can be prepared starting with magnesium oxide.
ii) State one use of calcium carbonate.
Date posted:
March 19, 2019
.
Answers (1)
-
a)The set up below was used during electrolysis of aqueous copper (II) sulphate using inert electrodes.
(Solved)
a)The set up below was used during electrolysis of aqueous copper (II) sulphate using inert electrodes.
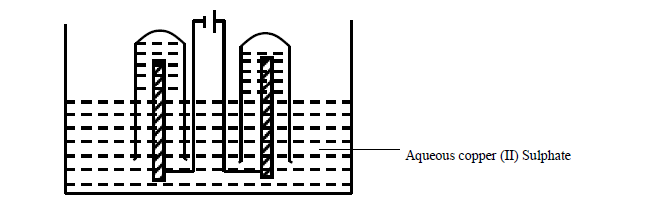
i) Name a suitable pair of electrodes for this experiment.
ii) Identify the ions and cations in the solution.
iii) On the diagram label the cathode.
iv) Write ionic equations for the reactions that took place at the anode
v) Explain the change that occurred to the Copper (II) Sulphate solution during the experiment.
vi) During the electrolysis a current of 2 amperes was passed through the solution for 4 hours. Calculate the volume of the gas produced at the anode. (1 Faraday = 96500 coulombs and volume of gas at room temperature is 24000cm3 )
b) i) Draw a diagram to show how an impure copper lump can be refined through electrolysis.
ii) State one other use of electrolysis other than the one shown in b (ii) above.
Date posted:
March 19, 2019
.
Answers (1)
-
The electron arrangement of ions Q2- and R3+ are as 2, 8, 8, and 2,8 respectively.
(a) Write the electron arrangement of the elements Q and...
(Solved)
The electron arrangement of ions Q2- and R3+ are as 2, 8, 8, and 2,8 respectively.
(a) Write the electron arrangement of the elements Q and R
(b)Write the formula of the compound that would be formed between Q and R
Date posted:
March 19, 2019
.
Answers (1)
-
(a) Below is a paper chromatogram of pure substances W, X and Y
(Solved)
(a) Below is a paper chromatogram of pure substances W, X and Y
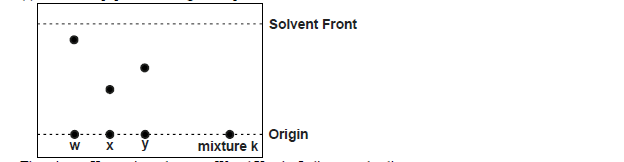
The mixture K contains substances W and X only. Indicate on the diagram the chromatogram of K.
(b) State one application of chromatography.
Date posted:
March 19, 2019
.
Answers (1)
-
The atomic number of an element A is 11 and that of B to 8.(a)Write down a possible formula of compound formed between A and...
(Solved)
The atomic number of an element A is 11 and that of B to 8.
(a)Write down a possible formula of compound formed between A and B.
(b)Draw a dot (•) and cross (×) diagram to show bonding in compound farmed.
Date posted:
March 19, 2019
.
Answers (1)
-
The table below shows the effect of passing an electric current through substances using unreactive electrodes,and a bulb in the circuit.
(Solved)
The table below shows the effect of passing an electric current through substances using unreactive electrodes,and a bulb in the circuit.
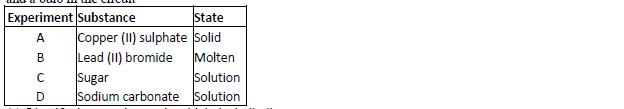
a)Identify the experiments in which the bulb did not light.
(b)Explain your answer in (a) above.
Date posted:
March 19, 2019
.
Answers (1)
-
Moist hydrogen sulphide gas was passed through a tube containing wet sulphur (IV) oxide gas as shown below.
(Solved)
Moist hydrogen sulphide gas was passed through a tube containing wet sulphur (IV) oxide gas as shown below.
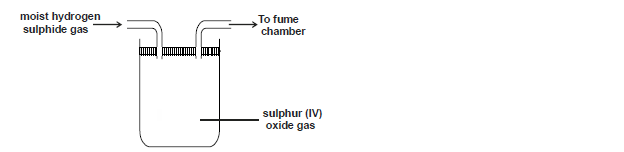
(a) State the observation (s) made.
(b) Write an equation for the reaction above.
(c) Giving a reason, which substance undergoes reduction above.
Date posted:
March 19, 2019
.
Answers (1)
-
Give two differences between chemical reactions and nuclear reactions.
(Solved)
Give two differences between chemical reactions and nuclear reactions.
Date posted:
March 19, 2019
.
Answers (1)