(a) B – Acid had higher concentration
(b) The reaction rate is initially high because of high concentration but decreases steadily as
concentration also decreases.
sharon kalunda answered the question on March 29, 2019 at 11:35
-
Sulphur (IV) oxide gas was bubbled into acidified potassium chromate (VI) and iron (III) sulphate solutions respectively.Explain the observations made in each case.
(Solved)
Sulphur (IV) oxide gas was bubbled into acidified potassium chromate (VI) and iron (III) sulphate solutions respectively.Explain the observations made in each case.
i) With potassium chromate (VI).
(ii) With iron (III) sulphate.
Date posted:
March 29, 2019
.
Answers (1)
-
The solubility of salt Y at 600 is 40g/100g of water and 48g/100g of water at 1000C.
(i) How much salt Y would saturate 190g of...
(Solved)
The solubility of salt Y at 600 is 40g/100g of water and 48g/100g of water at 1000C.
(i) How much salt Y would saturate 190g of water at 1000C.
(ii) 150g of saturated solution of Y at 1000C is cooled to 600C. Calculate the mass of Y that crystallizes out.
Date posted:
March 29, 2019
.
Answers (1)
-
Four solutions of pH 7, 2, 8.5 and 13 respectively were each reacted with calcium turnings. Identify two solutions in which hydrogen gas would be...
(Solved)
Four solutions of pH 7, 2, 8.5 and 13 respectively were each reacted with calcium turnings. Identify two solutions in which hydrogen gas would be produced. Explain each case.
Date posted:
March 29, 2019
.
Answers (1)
-
Describe how you would prepare a dry sample of zinc carbonate in the laboratory starting with zinc chloride solid.
(Solved)
Describe how you would prepare a dry sample of zinc carbonate in the laboratory starting with zinc chloride solid.
Date posted:
March 29, 2019
.
Answers (1)
-
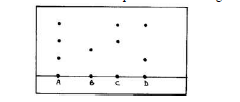
The diagrams below represent a list of apparatus which are commonly used in a chemistry laboratory:-
(Solved)
The diagrams below represent a list of apparatus which are commonly used in a chemistry laboratory:-
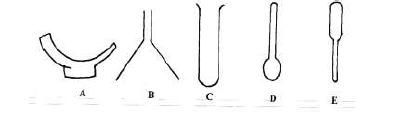
(a) Give the correct order of the apparatus, using the letters only, show the correct arrangement that can be used to prepare and investigate the nature of PH of a sample of onion solution.
(b) Name one chemical substance and apparatus that is needed in the experiment.
Date posted:
March 29, 2019
.
Answers (1)
-
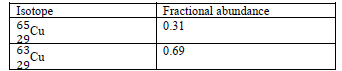
Use the information in the table below to determine the relative atomic mass of copper.
(Solved)
Use the information in the table below to determine the relative atomic mass of copper.
Date posted:
March 29, 2019
.
Answers (1)
-
The curve shown below was obtained when solid naphthalene was heated to boiling.
(Solved)
The curve shown below was obtained when solid naphthalene was heated to boiling.
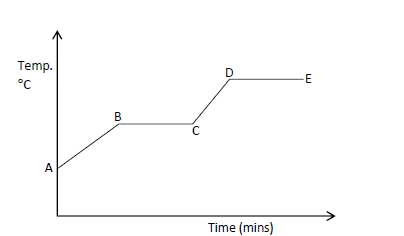
(a) Explain in molecular terms the changes occurring in portions.
(i) AB.
(ii) DE.
(b) What is the significance of portion BC?
Date posted:
March 29, 2019
.
Answers (1)
-
3.22g of hydrated sodium sulphate, Na2SO4.XH2O were heated to a constant mass of 1.42g. Determine the value of X in the formula. (Na = 23.0,...
(Solved)
3.22g of hydrated sodium sulphate, Na2SO4.XH2O were heated to a constant mass of 1.42g. Determine the value of X in the formula. (Na = 23.0, S = 32.0, O = 16.0, H = 1).
Date posted:
March 29, 2019
.
Answers (1)
-
The figure below shows a set-up used in electrolysis of lead iodide.
(Solved)
The figure below shows a set-up used in electrolysis of lead iodide.
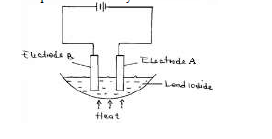
(a) Why is heating necessary?
(b) Write the equation of the reaction that occurs at the cathode.
(c) At which electrode does reduction occurs.
Date posted:
March 29, 2019
.
Answers (1)
-
Draw a dot (.)/cross (X) diagram to show bonding in Cl2O. (Cl = 17, O = 8).
(Solved)
Draw a dot (.)/cross (X) diagram to show bonding in Cl2O. (Cl = 17, O = 8).
Date posted:
March 29, 2019
.
Answers (1)
-
The following chromatogram was obtained in an experiment to investigate the components present in certain dyes.
(Solved)
The following chromatogram was obtained in an experiment to investigate the components present in certain dyes.
(a) Which two dyes when mixed would produce A?
(b) Which dye is pure?
(c) Indicate on the diagram the solvent front.
Date posted:
March 29, 2019
.
Answers (1)
-
Dry hydrogen chloride gas was passed over heated iron wool as shown below.
(Solved)
Dry hydrogen chloride gas was passed over heated iron wool as shown below.
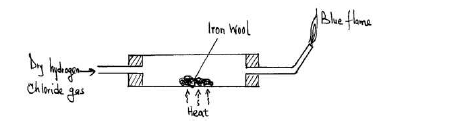
(a) State the observation made in the combustion tube at the end of the experiment.
(b) Write the equation for the reaction taking place:-
(i) In the combustion tube.
(ii) Leading to production of the blue flame.
Date posted:
March 29, 2019
.
Answers (1)
-
The diagram below is a set-up of apparatus used to react ammonia gas with iron (IV) chloride solution.
(Solved)
The diagram below is a set-up of apparatus used to react ammonia gas with iron (IV) chloride solution.
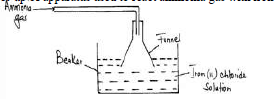
(a) State the observation made in the beaker after a few minutes.
(b) Explain why the funnel is used to deliver the ammonia into the solution.
Date posted:
March 29, 2019
.
Answers (1)
-
100cm³ of sulphur (IV) oxide takes 20 seconds to diffuse through a porous plate. What volume of oxygen gas would diffuse through the same plate...
(Solved)
100cm³ of sulphur (IV) oxide takes 20 seconds to diffuse through a porous plate. What volume of oxygen gas would diffuse through the same plate in 30 seconds under similar conditions. (S = 32, O = 16).
Date posted:
March 29, 2019
.
Answers (1)
-
In the down’s process (used for extraction of sodium) a certain salt is added to lower the melting point of sodium chloride from 8000C to...
(Solved)
In the down’s process (used for extraction of sodium) a certain salt is added to lower the melting point of sodium chloride from 8000C to about 6000C.
(i) Identify the salt added.
(ii) Why is it necessary to lower the temperature?
(iii) Give one use of sodium.
Date posted:
March 29, 2019
.
Answers (1)
-
The set-up below shows how gas A was prepared and reacted with heated magnesium.
(Solved)
The set-up below shows how gas A was prepared and reacted with heated magnesium.
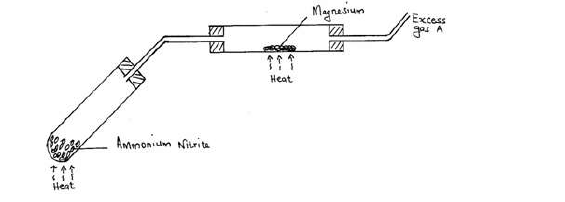
(a) Give a reason why it is not advisable to heat magnesium before heating ammonium nitrite.
(b) (i) Identify gas A.
(ii) Write a chemical equation for the reaction between gas A and magnesium.
Date posted:
March 29, 2019
.
Answers (1)
-
When 25cm³ of 0.5M HCl is added to 25cm³ of 0.5M NaOH the temperature of the solution rose from 230C to 260C. Given that the...
(Solved)
When 25cm³ of 0.5M HCl is added to 25cm³ of 0.5M NaOH the temperature of the solution rose from 230C to 260C. Given that the density of the solution is 1gcmˉ³ and its specific heat capacity is 4.2Jgˉ¹Kˉ¹.
(a) Determine the amount f heat evolved that caused the temperature rise.
(b) Work out the molar enthalpy of neutralization for this reaction.y is 4.2Jgˉ¹Kˉ¹.
Date posted:
March 29, 2019
.
Answers (1)
-
The set-up was used to prepare carbon (IV) oxide and investigate its properties.
(Solved)
The set-up was used to prepare carbon (IV) oxide and investigate its properties.
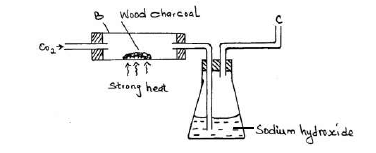
(a) Write an equation for the reaction in vessel B.
(b) What is the role of sodium hydroxide solution in the set-up?
(c) What would be observed if a burning splint is introduced at jet C?
Date posted:
March 29, 2019
.
Answers (1)
-
20cm³ of a dibasic acid required 25cm³ of 0.1M NaOH for complete neutralization.
(a) How many moles of sodium hydroxide reacted with the dibasic acid?
(b)...
(Solved)
20cm³ of a dibasic acid required 25cm³ of 0.1M NaOH for complete neutralization.
(a) How many moles of sodium hydroxide reacted with the dibasic acid?
(b) Calculate the concentration of the dibasic acid in moles per litre.
Date posted:
March 29, 2019
.
Answers (1)
-
0.92g of ethanol were found to burn in excess air producing a temperature rise of 32.5oC in 200cm3 of water(C=12.0,H=1.0,O=16.0) Density of water is 1g/cm3,...
(Solved)
0.92g of ethanol were found to burn in excess air producing a temperature rise of 32.5oC in 200cm3 of water(C=12.0,H=1.0,O=16.0) Density of water is 1g/cm3, specific heat capacity of water is 4.2KjKg-1K-1.
(a) Write the equation for the combustion of ethanol.
(b) Determine the molar heat of combustion of ethanol
Date posted:
March 29, 2019
.
Answers (1)