Total distance = Area under graph;
= ½ (12 + 5) x 20; OR
= 170m;
Average speed = 170m/12s
= 14.17m/s;
sharon kalunda answered the question on April 4, 2019 at 06:29
-
A bullet of mass 150g moving at an initial velocity of 80m/s strikes a suspended block
of mass 2.5kg
(Solved)
A bullet of mass 150g moving at an initial velocity of 80m/s strikes a suspended block
of mass 2.5kg
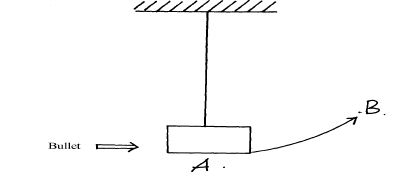
(a)The block swings from point A to B. Determine the vertical displacement between A and B
(b) What observations are you likely to observe on the block after collision
Date posted:
April 4, 2019
.
Answers (1)
-
One end of a metal rod is heated in a flame. After some time the other end becomes hot.
Explain this observation
(Solved)
One end of a metal rod is heated in a flame. After some time the other end becomes hot.
Explain this observation
Date posted:
April 4, 2019
.
Answers (1)
-
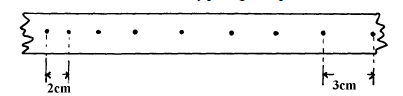
The figure below shows a section of a ticker tape. The dots were made at a frequency of 50 Hz.
Determine the acceleration of the trolley...
(Solved)
The figure below shows a section of a ticker tape. The dots were made at a frequency of 50 Hz.
Determine the acceleration of the trolley pulling the tape.
Date posted:
April 4, 2019
.
Answers (1)
-
Distinguish between the terms ‘uniform velocity’ and ‘uniform acceleration’
(Solved)
Distinguish between the terms ‘uniform velocity’ and ‘uniform acceleration’
Date posted:
April 4, 2019
.
Answers (1)
-
When a load of 20N is hung from a spring, the spring has a length of 15 cm. The same spring
has a length of 17...
(Solved)
When a load of 20N is hung from a spring, the spring has a length of 15 cm. The same spring
has a length of 17 cm when supporting a load of 25N. Determine the spring length when
supporting no load.
Date posted:
April 4, 2019
.
Answers (1)
-
Three identical springs with proportionality constant of 50N/m. each are connected as shown
below and support a load of 60N
(Solved)
Three identical springs with proportionality constant of 50N/m. each are connected as shown
below and support a load of 60N
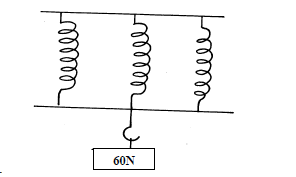
Calculate;
(a) The extension in one spring
(b) The extensive proportionality constant of the springs
Date posted:
April 4, 2019
.
Answers (1)
-
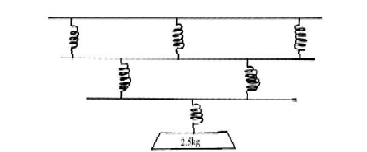
A single light spring extends by 3.6cm when supporting a load of 2.5kg. What is the total
extension in the arrangement shown below. (Assume the springs...
(Solved)
A single light spring extends by 3.6cm when supporting a load of 2.5kg. What is the total
extension in the arrangement shown below. (Assume the springs are identical)
Date posted:
April 4, 2019
.
Answers (1)
-
Sketch a graph of length of a helical spring against compressing force until the coils of the
spring are in contact
(Solved)
Sketch a graph of length of a helical spring against compressing force until the coils of the
spring are in contact
Date posted:
April 4, 2019
.
Answers (1)
-
The following results were recorded in an experiment where different masses were hung on the end of a long spring whose other end was firmly...
(Solved)
The following results were recorded in an experiment where different masses were hung on the end of a long spring whose other end was firmly fixed. The length of the spring and the mass hanging from it were recorded as below. Original length of spring was 40cm.
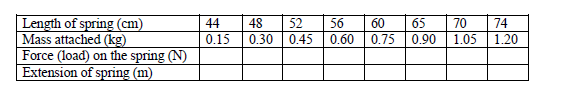
(a) Complete the table for load and corresponding extensions
(b) Plot a graph of extension of the spring against load on the spring on the grid provided
(c) Determine the spring constant using the linear section of the graph
(d) Give an explanation why the slope of the graph changes when a mass greater than 0.75kg is attached to the spring
(e) From the list of quantities below, select quantities that are vector quantities:-
speed, density, force, acceleration and current
Date posted:
April 4, 2019
.
Answers (1)
-
Sea water of density 1.04g/cm3 is being pumped into a tank through a pipe of uniform cross-sectional area of 3.142cm2. If the speed of water...
(Solved)
Sea water of density 1.04g/cm3 is being pumped into a tank through a pipe of uniform cross-sectional area of 3.142cm2. If the speed of water in the pipe is 5m/s, determine the volume flux in S.I units
Date posted:
April 4, 2019
.
Answers (1)
-
The figure below shows a light body floating in a container
(Solved)
The figure below shows a light body floating in a container
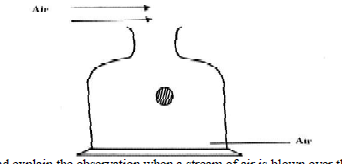
State and explain the observation when a stream of air is blown over the mouth of the container
as shown
Date posted:
April 4, 2019
.
Answers (1)
-
The diagram below figure shows a cross- section of an aeroplane wing. When the aeroplane is moving at a constant height and constant speed, an...
(Solved)
The diagram below figure shows a cross- section of an aeroplane wing. When the aeroplane is moving at a constant height and constant speed, an upward force is exerted on its wing.
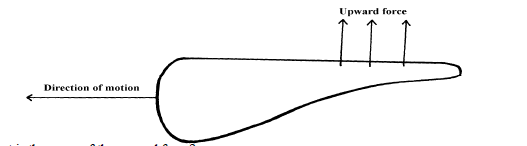
What is the cause of the upward force?
Date posted:
April 4, 2019
.
Answers (1)
-
In the diagram in figure, water flows through a section of a pipe whose diameter changes as shown
(Solved)
In the diagram in figure, water flows through a section of a pipe whose diameter changes as shown

Sketch a graph of the variation of pressure along the line ABCD.
Date posted:
April 4, 2019
.
Answers (1)
-
The diagram below shows a section of a pipe with different cross – sectional area.
(Solved)
The diagram below shows a section of a pipe with different cross – sectional area.
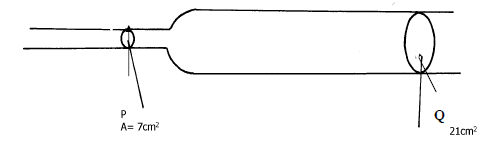
If water flows with a velocity of 5m/s in section P, what would be the velocity of water in section Q if the cross sectional areas are as shown?
Date posted:
April 4, 2019
.
Answers (1)
-
Figure below shows the cross-section of an aerofoil, with the aeroplane moving in the direction shown by the arrow.
(Solved)
Figure below shows the cross-section of an aerofoil, with the aeroplane moving in the direction shown by the arrow.
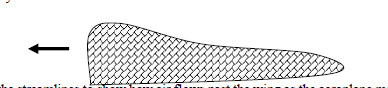
Sketch the streamlines to show how air flows past the wing as the aeroplane moves
Date posted:
April 4, 2019
.
Answers (1)
-
A uniform metre rule is balanced at its centre. It is balanced by the 30N, 5N and the magnetic
force between P and Q. P is...
(Solved)
A uniform metre rule is balanced at its centre. It is balanced by the 30N, 5N and the magnetic
force between P and Q. P is fixed and Q has a weight of 5N
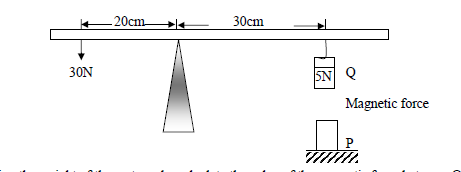
Ignoring the weight of the metre rule, calculate the value of the magnetic force between Q and P
Date posted:
April 3, 2019
.
Answers (1)
-
Figure shows a spring coin which tends to remain vertical but topples immediately it stops spinning.
(Solved)
Figure shows a spring coin which tends to remain vertical but topples immediately it stops spinning.
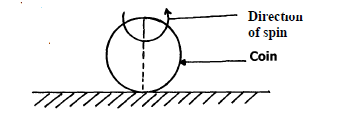
Explain this observation
Date posted:
April 3, 2019
.
Answers (1)
-
In the set up in figure, the metre rule is in equilibrium
(Solved)
In the set up in figure, the metre rule is in equilibrium.
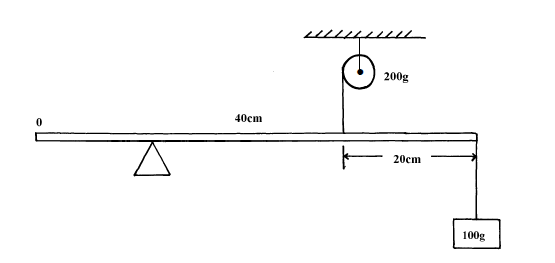
Given that the metre rule is uniform, determine its weight
Date posted:
April 3, 2019
.
Answers (1)
-
The figure below shows a wine glass
(Solved)
The figure below shows a wine glass
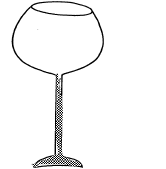
State and explain the effect on its stability when wine is put into the glass.
Date posted:
April 3, 2019
.
Answers (1)
-
A uniform half metre long beam, pivoted at the 10cm mark, balances when a mass of 150g is suspended at the 0cm mark as shown...
(Solved)
A uniform half metre long beam, pivoted at the 10cm mark, balances when a mass of 150g is suspended at the 0cm mark as shown below:
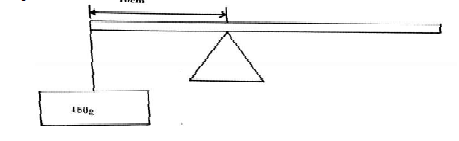
Calculate the weight of the beam
Date posted:
April 3, 2019
.
Answers (1)