-
Explain why a magnetic field is used in the TV deflection system instead of an electric field
(Solved)
Explain why a magnetic field is used in the TV deflection system instead of an electric field
Date posted:
April 5, 2019
.
Answers (1)
-
Name one factor that determines the velocity of photoelectrons produced on a metal surface
when light shine on it
(Solved)
Name one factor that determines the velocity of photoelectrons produced on a metal surface
when light shine on it
Date posted:
April 5, 2019
.
Answers (1)
-
The variation of frequency f with the maximum kinetic energy Ek of the emitted electrons is shown on the graph below:
(Solved)
The variation of frequency f with the maximum kinetic energy Ek of the emitted electrons is shown on the graph below:
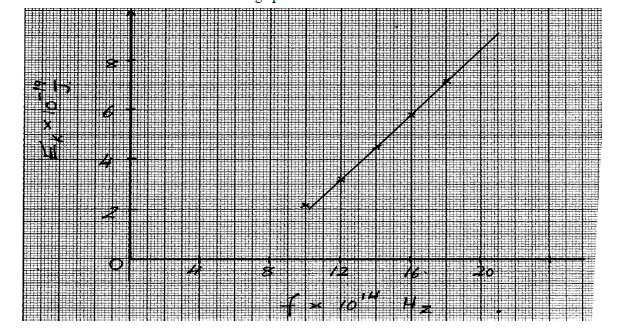
Find:
(i) the value of the Planck’s constant h
(ii) the work function, Wo
Date posted:
April 5, 2019
.
Answers (1)
-
The solid of mass 12kg, weighs 100N and 94N when fully immersed in water and liquid L respectively. Calculate:-
(Solved)
The solid of mass 12kg, weighs 100N and 94N when fully immersed in water and liquid L respectively. Calculate:-
(i) The density of the liquid in S.I units
(ii) The density of the solid
Date posted:
April 5, 2019
.
Answers (1)
-
Define thermionic emission.
(Solved)
Define thermionic emission.
Date posted:
April 5, 2019
.
Answers (1)
-
An electrical heater is rated 3.45KW. The heater is immersed in 2.4kg of water.Calculate the minimum time it takes for the temperature of the water...
(Solved)
An electrical heater is rated 3.45KW. The heater is immersed in 2.4kg of water.Calculate the minimum time it takes for the temperature of the water to rise from 23.0oC to 69.0oC. (Specific heat capacity of water = 4.2Jg/K)
Date posted:
April 5, 2019
.
Answers (1)
-
An electric kettle rated 3.0Kw, 240V is filled with water. If the water boiled after 8 minutes
of heating, determine the energy used in boiling the...
(Solved)
An electric kettle rated 3.0Kw, 240V is filled with water. If the water boiled after 8 minutes
of heating, determine the energy used in boiling the water.
Date posted:
April 5, 2019
.
Answers (1)
-
An electric kettle is rated 3KW, 250V. Determine the resistance of the coil
(Solved)
An electric kettle is rated 3KW, 250V. Determine the resistance of the coil
Date posted:
April 5, 2019
.
Answers (1)
-
An electric bulb is rated 40W, 240V. What is the resistance of its filament?
(Solved)
An electric bulb is rated 40W, 240V. What is the resistance of its filament?
Date posted:
April 5, 2019
.
Answers (1)
-
Given that a lamp is rated 45W 240V. Calculate the resistance of the heating element.
(Solved)
Given that a lamp is rated 45W 240V. Calculate the resistance of the heating element.
Date posted:
April 5, 2019
.
Answers (1)
-
What is the relationship between periodic time and frequency of a progressive wave?
(Solved)
What is the relationship between periodic time and frequency of a progressive wave?
Date posted:
April 5, 2019
.
Answers (1)
-
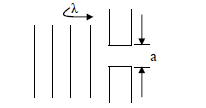
Complete the diagram below to show the shape of the wave fronts after passing
through the deep gap
(Solved)
Complete the diagram below to show the shape of the wave fronts after passing
through the deep gap
Date posted:
April 5, 2019
.
Answers (1)
-
The figure below shows water waves crossing a boundary between deep and shallow water. Complete the diagram to show the wave in the deep region
(Solved)
The figure below shows water waves crossing a boundary between deep and shallow water
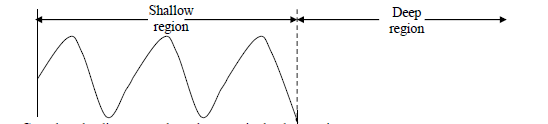
Complete the diagram to show the wave in the deep region.
Date posted:
April 5, 2019
.
Answers (1)
-
How many cubic centimeters make a gram?
(Solved)
How many cubic centimeters make a gram?
Date posted:
April 5, 2019
.
Answers (1)
-
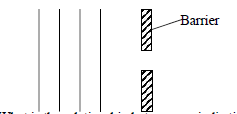
The figure below shows a series of plane waves approaching a gap. Complete the diagram to show the waves after passing through the gap.
(Solved)
In the figure below shows a series of plane waves approaching a gap. Complete the diagram to show the waves after passing through the gap.
Date posted:
April 5, 2019
.
Answers (1)
-
The figure below shows a wave profile.
(Solved)
The figure below shows a wave profile.
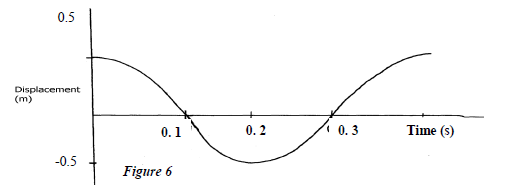
Determine the frequency of the wave.
Date posted:
April 5, 2019
.
Answers (1)
-
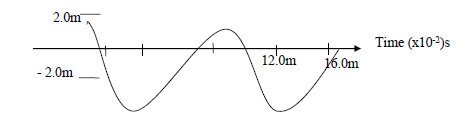
Determine the frequency of the wave shown below.
(Solved)
Determine the frequency of the wave shown below.
Date posted:
April 5, 2019
.
Answers (1)
-
Distinguish between diffraction and refraction of waves
(Solved)
Distinguish between diffraction and refraction of waves
Date posted:
April 5, 2019
.
Answers (1)
-
The figure below shows two loudspeakers L1 and L2 connected to a signal generator.
(Solved)
The figure below shows two loudspeakers L1 and L2 connected to a signal generator.
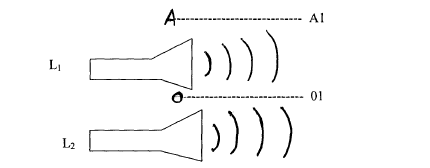
An observer walks along the line 0-01 (equidistant from L1 and L2) and another along the
Line AA1.Explain the observation made by each and give reasons to your answer
Date posted:
April 5, 2019
.
Answers (1)
-
State any two conditions necessary for the establishment of a stationary wave
(Solved)
State any two conditions necessary for the establishment of a stationary wave
Date posted:
April 5, 2019
.
Answers (1)