-
A car is brought to rest from 20m/s in 2 seconds. Determine
(Solved)
A car is brought to rest from 20m/s in 2 seconds. Determine
a. Its acceleration
b. The magnitude of acceleration
c. Its deceleration
Date posted:
April 10, 2019
.
Answers (1)
-
A ship cruises 370 km towards east in in 10 hours. It then changes course southwards covering165 km in 5 hours. Determine
(Solved)
A ship cruises 370 km towards east in in 10 hours. It then changes course southwards covering
165 km in 5 hours. Determine
a. Total displacement of the ship.
b) The average speed of the ship.
c. The average velocity of the ship
Date posted:
April 10, 2019
.
Answers (1)
-
The half-life of a radio-active substance is 138 days. A sample of the substance has 8 x 10¹⁰ un-decayed nuclei at time t = 0....
(Solved)
The half-life of a radio-active substance is 138 days. A sample of the substance has 8 x 10¹⁰ un-decayed nuclei at time t = 0. How many un-decayed nuclei will be left after 690 days?
Date posted:
April 5, 2019
.
Answers (1)
-
One of the application of Beta emission (B) is controlling thickness gauge. Explain
how they are used for this purpose?
(Solved)
One of the application of Beta emission (B) is controlling thickness gauge. Explain
how they are used for this purpose?
Date posted:
April 5, 2019
.
Answers (1)
-
Th disintegrates into radium (Ra) by emission of two alpha and two beta particles as in equation.
(Solved)
Th disintegrates into radium (Ra) by emission of two alpha and two beta particles as in equation.
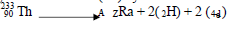
State
i) The atomic number of the daughter nuclide
ii) The mass number of the daughter nuclide
Date posted:
April 5, 2019
.
Answers (1)
-
The diagram below shows the paths taken by three radiations A, B and C from a radio
active isotope through an electric field
(Solved)
The diagram below shows the paths taken by three radiations A, B and C from a radio
active isotope through an electric field
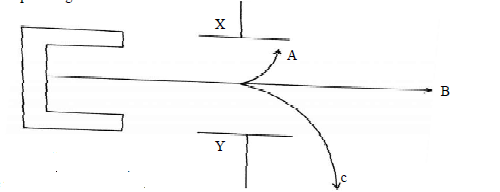
i) State the charge on plate Y
ii) Identify the radiation A and C
iii) Give a reason why C deviates move A
Date posted:
April 5, 2019
.
Answers (1)
-
Uranium 235 was bombarded with a neutron and fission took place in the following manner:
(Solved)
Uranium 235 was bombarded with a neutron and fission took place in the following manner:

Determine the values of a and b
Date posted:
April 5, 2019
.
Answers (1)
-
Alpha particles have low penetrating power as opposed to beta particles. Give a reason for this
(Solved)
Alpha particles have low penetrating power as opposed to beta particles. Give a reason for this
Date posted:
April 5, 2019
.
Answers (1)
-
What evidence supports the fact that gamma rays are not charged
(Solved)
What evidence supports the fact that gamma rays are not charged
Date posted:
April 5, 2019
.
Answers (1)
-
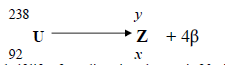
Determine the value of x and y in the nuclear equation below:-
(Solved)
Determine the value of x and y in the nuclear equation below:-
Date posted:
April 5, 2019
.
Answers (1)
-
A radioactive element decays to 1/128 of its original activity after 49 days. Determine its
half –life
(Solved)
A radioactive element decays to 1/128 of its original activity after 49 days. Determine its
half –life
Date posted:
April 5, 2019
.
Answers (1)
-
Below is a nuclear reaction
(Solved)
Below is a nuclear reaction
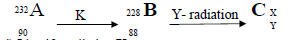
i) Identify radiation K
ii) Determine the value of X and Y
Date posted:
April 5, 2019
.
Answers (1)
-
The figure shows the circuit of a modern X-ray tube
(Solved)
The figure shows the circuit of a modern X-ray tube
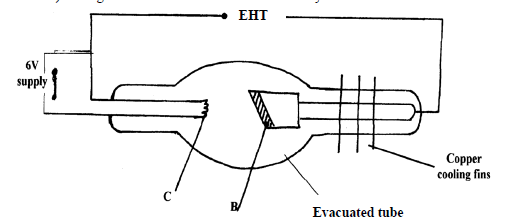
Name the part labeled C and state its function
Date posted:
April 5, 2019
.
Answers (1)
-
The diagram below shows simplified diagram of an x-ray tube,
(Solved)
The diagram below shows simplified diagram of an x-ray tube,
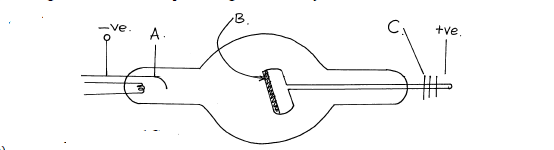
(a) Name the parts A, B, and C.
(b) What adjustments would be made to:
(i) Increase the penetrating power of the x-rays produced.
(ii) Increase the intensity of the rays produced.
(c) Name a suitable material for the part marked B and give a reason for your choice.
(d) Name a suitable material for the part marked C and sate its purpose.
(e) Why is it necessary to maintain a vacuum inside the tube?
Date posted:
April 5, 2019
.
Answers (1)
-
An x-ray tube is operating with an anode potential of 12Kv and a current of 10.0m.A:
(Solved)
An x-ray tube is operating with an anode potential of 12Kv and a current of 10.0m.A:
(i) Calculate the number of electrons hitting the anode per second
(ii) Determine the velocity with which the electrons strike the target
Date posted:
April 5, 2019
.
Answers (1)
-
The figure below shows an x-ray tube:
(Solved)
The figure below shows an x-ray tube:
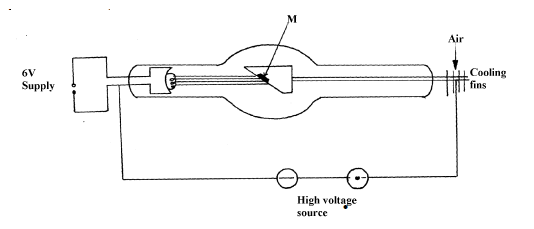
(a) Indicate on the diagram the path of x-ray beam supplied by the tube
(b) Why is M set at angle of 45o relative to the electron beam?
(c) Name a suitable metal that can be used for part M and give a reason for your choice
(d) State how the following can be controlled:-
(i) Intensity
(ii) Penetrating power
(iii) The exposure to patients
Date posted:
April 5, 2019
.
Answers (1)
-
The table below shows the electromagnetic spectrum;
(Solved)
The table below shows the electromagnetic spectrum;
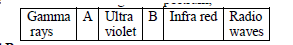
i) Identify A and B
ii) State one use for each
Date posted:
April 5, 2019
.
Answers (1)
-
An x-ray tube must be highly evaluated. Give a reason for this
(Solved)
An x-ray tube must be highly evaluated. Give a reason for this
Date posted:
April 5, 2019
.
Answers (1)
-
Give one use of X –rays in medicine
(Solved)
Give one use of X –rays in medicine
Date posted:
April 5, 2019
.
Answers (1)
-
The figure shows a cross- section of a bicycle dynamo. The wheel is connected by an axle
to a permanent cylindrical magnet and is rotated by...
(Solved)
The figure shows a cross- section of a bicycle dynamo. The wheel is connected by an axle
to a permanent cylindrical magnet and is rotated by the bicycle tyre
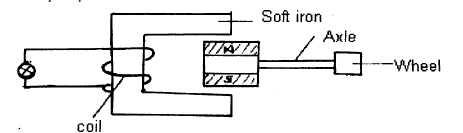
i) Explain why the bulb lights
ii) How can the bulb be made brighter
Date posted:
April 5, 2019
.
Answers (1)