-
Name the two major canals of the world
(Solved)
Name the two major canals of the world
Date posted:
April 23, 2019
.
Answers (1)
-
Define canal transport
(Solved)
Define canal transport
Date posted:
April 23, 2019
.
Answers (1)
-
Explain three attempted solution to African transport and communication problems.
(Solved)
Explain three attempted solution to African transport and communication problems.
Date posted:
April 23, 2019
.
Answers (1)
-
Give two major problems experienced by users of Kenyan roads
(Solved)
Give two major problems experienced by users of Kenyan roads
Date posted:
April 23, 2019
.
Answers (1)
-
State three benefits that Kenya would derive from road linkage with the rest of East African countries
(Solved)
State three benefits that Kenya would derive from road linkage with the rest of East African countries
Date posted:
April 23, 2019
.
Answers (1)
-
State any four problems facing air transport in Africa
(Solved)
State any four problems facing air transport in Africa
Date posted:
April 23, 2019
.
Answers (1)
-
State four advantages of the Mombasa-Nairobi pipeline.
(Solved)
State four advantages of the Mombasa-Nairobi pipeline.
Date posted:
April 23, 2019
.
Answers (1)
-
The diagram below shows the Great Lakes & St Lawrence Seaway:
(Solved)
The diagram below shows the Great Lakes & St Lawrence Seaway:
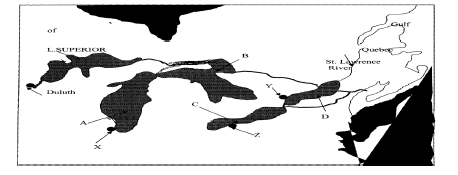
(i) Name the lakes marked A, B, & C .
(ii) Why was the St. Lawrence Sea way constructed between the Great Lakes and the
Pacific Ocean?
(iii) Identify the problems that initially existed along the seaway and how they were solved
Date posted:
April 23, 2019
.
Answers (1)
-
Name any three types of tertiary industry
(Solved)
Name any three types of tertiary industry
Date posted:
April 23, 2019
.
Answers (1)
-
Differentiate between a factory and industry
(Solved)
Differentiate between a factory and industry
Date posted:
April 23, 2019
.
Answers (1)
-
State three negative effects of industrialization
(Solved)
State three negative effects of industrialization
Date posted:
April 23, 2019
.
Answers (1)
-
State three factors that make industrialists prefer to locate their plants near already established industries
(Solved)
State three factors that make industrialists prefer to locate their plants near already established industries.
Date posted:
April 23, 2019
.
Answers (1)
-
Explain four problems that hinder development of Hydro-electric power projects in Africa
(Solved)
Explain four problems that hinder development of Hydro-electric power projects in Africa
Date posted:
April 23, 2019
.
Answers (1)
-
Explain three factors that influenced the location of Owen falls dam in Uganda
(Solved)
Explain three factors that influenced the location of Owen falls dam in Uganda
Date posted:
April 23, 2019
.
Answers (1)
-
Name two provinces in Kenya where maize is grown on large scale
(Solved)
Name two provinces in Kenya where maize is grown on large scale
Date posted:
April 23, 2019
.
Answers (1)
-
State three reasons why Kenya spent so little on importing maize during the year 2002
(Solved)
State three reasons why Kenya spent so little on importing maize during the year 2002
Date posted:
April 23, 2019
.
Answers (1)
-
Identify any three functions of hydro power reservoir other than power generation
(Solved)
Identify any three functions of hydro power reservoir other than power generation
Date posted:
April 23, 2019
.
Answers (1)
-
List two renewable fossil fuels
(Solved)
List two renewable fossil fuels
Date posted:
April 23, 2019
.
Answers (1)
-
Explain four benefits Kenya would get by striking oil in Isiolo
(Solved)
Explain four benefits Kenya would get by striking oil in Isiolo
Date posted:
April 23, 2019
.
Answers (1)
-
Name two sources of thermal electricity
(Solved)
Name two sources of thermal electricity
Date posted:
April 23, 2019
.
Answers (1)