-
The diagram below shows a right pyramid VPQRS with V as the vertex and a rectangular base PQRS. PQ = 3cm, QR =4cm. The height...
(Solved)
The diagram below shows a right pyramid VPQRS with V as the vertex and a rectangular base PQRS. PQ = 3cm, QR =4cm. The height of the pyramid is 6cm.PM = MQ and OQ = NR.
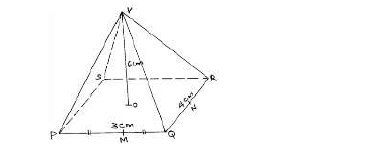
(a) Calculate.
(i) the length PV.
(ii) the angle between face VPQ and the base.
(b) (i) the slant height VM and VN.
(ii) What is the surface area of the pyramid?
Date posted:
April 25, 2019
.
Answers (1)
-
In the figure below AOC is a diameter of the circle centre O. AB = BC and Angle ACD = 350, EBF is a tangent...
(Solved)
In the figure below AOC is a diameter of the circle centre O. AB = BC and Angle ACD = 350, EBF is a tangent to the circle at B. G is a point on minor arc CD.
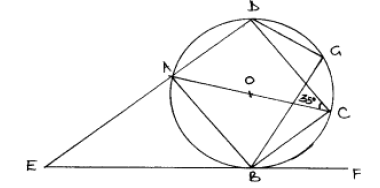
Calculate the size of the following angles giving reasons in each case.
(a) Angle BCD.
(b) Obtuse angle BOD.
(c) Angle BAD.
(d) Angle CGD.
(e) Angle AEB.
Date posted:
April 25, 2019
.
Answers (1)
-
Two towns A and B lie on the same parallel of latitudes 600N. If the longitudes of A and B are 420W and 290E respectively.
(Solved)
Two towns A and B lie on the same parallel of latitudes 600N. If the longitudes of A and B are 420W and 290E respectively.
(a) Find the distance between A and B in nautical miles along the parallel of latitude.
(b) Find the local time at A if at B is 1.00pm.
(c) Find the distance between A and B in km.
(d) If C is another town due South of A and 10010km away from A, Find the co-ordinate of C.
Date posted:
April 25, 2019
.
Answers (1)
-
A two digit number is formed from the first four prime numbers.
(Solved)
A two digit number is formed from the first four prime numbers.
(a) Draw the table to show the possible outcomes.
(b) Calculate the probability that a number chosen from the two digits is even number.
Date posted:
April 25, 2019
.
Answers (1)
-
Find C that divide AB externally in the ratio 5: 2, given that
(Solved)
Find C that divide AB externally in the ratio 5: 2, given that
A (3, -6, 9) and B (-15, 3, 12).
Date posted:
April 25, 2019
.
Answers (1)
-
Points P, Q and R are points on the circumference of a circle. If PQ = PR = 13cm and QR = 10cm, what is...
(Solved)
Points P, Q and R are points on the circumference of a circle. If PQ = PR = 13cm and QR = 10cm, what is the radius of
the circle.
Date posted:
April 25, 2019
.
Answers (1)
-
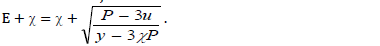
Make P the subject of the formula.
(Solved)
Make P the subject of the formula.
Date posted:
April 25, 2019
.
Answers (1)
-
The mass of a mixture A of beans and maize is 72kg. The ratio of beans to maize is 3: 5 respectively. Find the mass...
(Solved)
The mass of a mixture A of beans and maize is 72kg. The ratio of beans to maize is 3: 5 respectively. Find the mass of
maize in the mixture.
Date posted:
April 25, 2019
.
Answers (1)
-
An Arc of a circle of radius 40cm subtends an angle of 1260 at the centre of the circle.
(Solved)
An Arc of a circle of radius 40cm subtends an angle of 1260 at the centre of the circle.
(a) Calculate:
(i) the length of the arc.
(ii) the area of the sector.
(b) The sector is folded to form a cone.
Calculate:
(i) the radius of the base of the cone.
(ii) the height of the cone.
(iii) the capacity of the cone in litres.
Date posted:
April 25, 2019
.
Answers (1)
-
The displacement S metres of a moving particle after t seconds is given by
S = 2t³ - 5t² + 4t + 2
(Solved)
The displacement S metres of a moving particle after t seconds is given by
S = 2t³ - 5t² + 4t + 2
Determine
(a) the velocity of the particle when t = 2.
(b) the value(s) of t when the particle is momentarily at rest.
(c) the displacement when the particle is momentarily at rest.
(d) the acceleration of the particle when t = 5.
Date posted:
April 25, 2019
.
Answers (1)
-
A truck left town X at 11.45am and travelled towards town Y at an average speed of 60km/hr. A car left town X at
2.15pm on...
(Solved)
A truck left town X at 11.45am and travelled towards town Y at an average speed of 60km/hr. A car left town X at
2.15pm on the same day and travelled along the same road at an average speed of 100km/hr. The distance between
the two towns is 500km.
(a) Calculate the time of the day when the car overtook the truck.
(b) The distance from Y when the car overtook the truck.
(c) After overtaking the bus, both vehicles continued towards Y at their original speeds. Find how long the car had to
wait at town Y before the truck arrived.
Date posted:
April 25, 2019
.
Answers (1)
-
A trader bought 8 cows and 12 goats for a total of Ksh.294,000. If he had bought 1 more cows and 3 more goats he...
(Solved)
A trader bought 8 cows and 12 goats for a total of Ksh.294,000. If he had bought 1 more cows and 3 more goats he would have spend Ksh.337,500.
(a) Form two equations to represent the above information.
(b) Use matrix method to determine the cost of a cow and that of a goat.
(c) The trader sold the animals he had bought making a profit of 40% per low and 45% per goat.
(i) Calculate the total amount of money he received.
(ii) Determine his profit in Kenya shillings.
Date posted:
April 25, 2019
.
Answers (1)
-
A square carpet is laid on the floor of a room so that one of its sides is against a side of a room. If...
(Solved)
a)A square carpet is laid on the floor of a room so that one of its sides is against a side of a room. If leaves strips of
uncovered floor 1m wide along the two opposite sides and 2m wide along the remaining side. If the area of the
room is 64m², find the dimensions of the carpet.
(b) Solve the equation: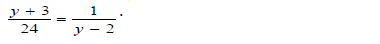
Date posted:
April 25, 2019
.
Answers (1)
-
A construction company requires to transport 288 tonnes of stones to sites P and Q. The company pays 48,000 to
transport 48 tonnes of stones for...
(Solved)
A construction company requires to transport 288 tonnes of stones to sites P and Q. The company pays 48,000 to
transport 48 tonnes of stones for every 28km. Joyce transported 96 tonnes to site P, 49km away.
(a) Find how much she was paid.
(b) Joyce spends Ksh.6000 to transport every 8 tonnes of stones to site P. Calculate her total profit.
(c) Kimani transported the remaining stones to site Q, 84km away. If he made 44% profit, find his transport cost.
Date posted:
April 25, 2019
.
Answers (1)
-
A point C is on a line PQ where PQ = 9cm. C divides PQ such that PC=4/7PQ .By construction locate C.
(Solved)
A point C is on a line PQ where PQ = 9cm. C divides PQ such that PC=4/7PQ .By construction locate C.
Date posted:
April 25, 2019
.
Answers (1)
-
The mass of two similar solid are 324g and 768g. Find
(Solved)
The mass of two similar solid are 324g and 768g. Find
(a) height of the smaller solid if the height of the bigger solid is 20cm.
(b) the surface area of the smaller solid if the surface area of the bigger solid is 40cm².
Date posted:
April 25, 2019
.
Answers (1)
-
(a) Express 1050 in terms of its prime factors.
(b) Determine the smallest positive number such that 1050p is a perfect square.
(Solved)
(a) Express 1050 in terms of its prime factors.
(b) Determine the smallest positive number such that 1050p is a perfect square.
Date posted:
April 25, 2019
.
Answers (1)
-
Two variables A and B are connected by the equation.
A = kBn
(Solved)
Two variables A and B are connected by the equation.
A = kBn
Where k and n are constants.
The table below gives values of A and B
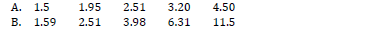
(b) On square paper draw a suitable straight line graph to represent the relation in (a) above (scale 1cm to represent 0.1 units on both axis)
(c) Use your graph to estimate the values of k and n in to one decimal place.
Date posted:
April 24, 2019
.
Answers (1)
-
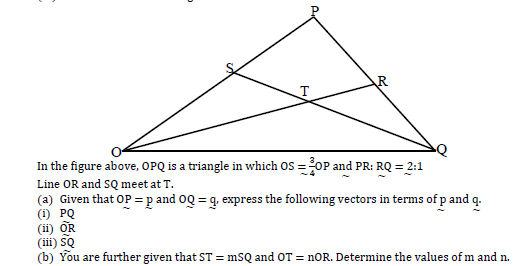
In the figure above, OPQ is a triangle in which;
(Solved)
Date posted:
April 24, 2019
.
Answers (1)
-
Veterinary researchers were experimenting with a new drug on fowls in a research station. A sample of fowls which were known to have the disease...
(Solved)
Veterinary researchers were experimenting with a new drug on fowls in a research station. A sample of fowls which were known to have the disease was used. In this sample 30 fowls were treated with the drug and the remaining 18 fowls were not treated.
(a) Calculate the probability that a fowl selected at random from the sample is
(i) treated with the drug
(ii) not treated with the drug
(b) The probability that a fowl treated with the drug will die is 1/10
, while the probability that one which is not
treated will die is 7/10
Calculate the probability that a fowl picked at random from the sample is
(i) treated with the drug and will die
(ii) not treated with the drug and will die
(iii) treated with the drug and will not die
(iv) not treated with the drug and will not die
Date posted:
April 24, 2019
.
Answers (1)