-
In triangle OAB, OA = a, OB = b and P lies on AB such that AP:PB = 3 : 5.
(Solved)
In triangle OAB, OA = a, OB = b and P lies on AB such that AP:PB = 3 : 5.
(a) In terms of a and b the vectors.
(i) AB
(ii) AP
(iii) BP
(iv) OP
Date posted:
May 8, 2019
.
Answers (1)
-
The following are masses of 25 people taken in a clinic.
(Solved)
The following are masses of 25 people taken in a clinic.
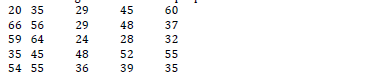
(a) Using a class width of 8 and starting with the lowest mass of the people. Make a frequency distribution table for the data.
(b) Calculate the median mass of the people.
(c) On the grid provided, draw a histogram to represent the information.
Date posted:
May 8, 2019
.
Answers (1)
-
The figure below a frustum of a solid cone of base radius 48cm and top radius 16cm. The height of the frustum is
21cm. (Take ??...
(Solved)
The figure below a frustum of a solid cone of base radius 48cm and top radius 16cm. The height of the frustum is
21cm. (Take 𝜋 =22/7) calculate:
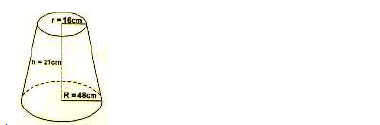
(a) The height of the solid cone.
(b) The volume of the solid frustum.
(c) The total surface area of the frustum.
Date posted:
May 8, 2019
.
Answers (1)
-
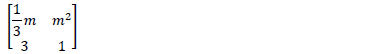
Determine the values of m for which the matrix below has no inverse
(Solved)
Determine the values of m for which the matrix below has no inverse
Date posted:
May 7, 2019
.
Answers (1)
-
A regular polygon with 3x sides has interior angle 400 greater than the one with x sides. What is x?
(Solved)
A regular polygon with 3x sides has interior angle 400 greater than the one with x sides. What is x?
Date posted:
May 7, 2019
.
Answers (1)
-
The image of P(0,2) under an enlargement with the factor 3 is P1(4,6). Find the centre of enlargement.
(Solved)
The image of P(0,2) under an enlargement with the factor 3 is P1(4,6). Find the centre of enlargement.
Date posted:
May 7, 2019
.
Answers (1)
-
The angle subtended by the major arc at the centre of the circle O is twice the angle subtended by the minor arc at the
centre....
(Solved)
The angle subtended by the major arc at the centre of the circle O is twice the angle subtended by the minor arc at the
centre. If the radius of the circle is 3.5cm, find the length of the minor arc. (Take 𝜋 =22/7)
Date posted:
May 7, 2019
.
Answers (1)
-
PQRS is a cyclic quadrilateral and O is the centre of the circle. angle QOS = 1500
(Solved)
PQRS is a cyclic quadrilateral and O is the centre of the circle. angle QOS = 1500
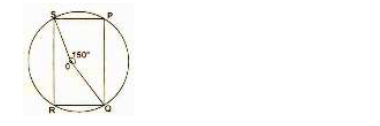
While giving reasons find:
(a) angle QPS
(b) angle QRS
Date posted:
May 7, 2019
.
Answers (1)
-
A test is conducted for the purpose of employing a suitable typist with the following results.
(Solved)
A test is conducted for the purpose of employing a suitable typist with the following results.

Calculate the mean typing speed.
Date posted:
May 7, 2019
.
Answers (1)
-
Find the equation of the normal to the curve y = x2 + 3x at the point P where x = 1.
(Solved)
Find the equation of the normal to the curve y = x2 + 3x at the point P where x = 1.
Date posted:
May 7, 2019
.
Answers (1)
-
A mobile phone seller gets a commission of Shs. 250 on every mobile phone that he sells. In a given month, he got
33,000 shillings.
(Solved)
A mobile phone seller gets a commission of Shs. 250 on every mobile phone that he sells. In a given month, he got
33,000 shillings.
(a) How many phones did he sell that month.
(b) If this commission is 2%. What is the sale price of each mobile phone?
Date posted:
May 7, 2019
.
Answers (1)
-
Simplify completely:
(Solved)
Simplify completely:

Date posted:
May 7, 2019
.
Answers (1)
-
Using a ruler and a pair of compasses only, construct a trapezium ABCD with AB parallel to DC. AB = 10cm, BC = 5cm,
CD =...
(Solved)
Using a ruler and a pair of compasses only, construct a trapezium ABCD with AB parallel to DC. AB = 10cm, BC = 5cm,
CD = 4cm and angle ABC = 450. Drop a perpendicular from C to meet AB to O. Measure AD and the altitude of the
trapezium.
Date posted:
May 7, 2019
.
Answers (1)
-
Points A(2,7) and B(-4,3) are points on a straight line. Find the equation of the perpendicular bisector of the line AB.
(Solved)
Points A(2,7) and B(-4,3) are points on a straight line. Find the equation of the perpendicular bisector of the line AB.
Date posted:
May 7, 2019
.
Answers (1)
-
Use reciprocal and square tables to evaluate to 4 significant figures the expression:
(Solved)
Use reciprocal and square tables to evaluate to 4 significant figures the expression:

Date posted:
May 7, 2019
.
Answers (1)
-
Without using mathematical tables or calculators evaluate:
(Solved)
Without using mathematical tables or calculators evaluate:

Date posted:
May 7, 2019
.
Answers (1)
-
a) Complete the table below for the equation y = 2x3 + 5x3 - x - 6
(Solved)
a) Complete the table below for the equation 𝑦 = 2𝑥3 + 5𝑥3 − 𝑥 − 6

b) On the grid provided draw the graph 𝑦 = 2𝑥2 + 5𝑥2 − 𝑥 − 6 𝑓𝑜𝑟 − 3.5 ≤ 𝑥 ≤ 2. Use 2cm to represent 1 unit
on the x-axis and 1cm to represent 5 units on the y-axis.
c) By drawing a suitable line use the graph in (b) to solve the equation.2𝑥3 + 5𝑥2 − 3𝑥 − 4 = 0
Date posted:
May 7, 2019
.
Answers (1)
-
a) Copy and complete the given table below to 2 decimal places.
(Solved)
a) Copy and complete the given table below to 2 decimal places.

b) Using the same axes plot the curves y=Sin(x+300) and y=Cos (x-15)
Taking 1 cm represented 300 and x-axis and 1cm represented 0.25cm on the y axis.
c) Using the graph state the amplitude of y=Cos (x-150)
d) Using the graph solve the equation: Sin (x+300)-Cos (x-150)=0
Date posted:
May 7, 2019
.
Answers (1)
-
A ship leaves an Island A (600N, 45 0E) and sails due west for 120hours to another island B.The average speed of the ship is...
(Solved)
A ship leaves an Island A (600N, 45 0E) and sails due west for 120hours to another island B.The average speed of the ship is 27 knots.
a) Find the position of the island B
b) Another island C is south of island B and lies on latitude 550N. Find the distance between Islands B and C in
nautical miles.
c) The ship leaves island B when the time at Island A is 12.30pm. On Monday and sailed to Island C. If the ship
increases its speed by 20% between B and C find out the time of arrival at island C to the nearest minutes and the
day.
Date posted:
May 7, 2019
.
Answers (1)
-
a) Using a ruler and pair of compasses only construct a square ABCD of sides 6cm.
(Solved)
a) Using a ruler and pair of compasses only construct a square ABCD of sides 6cm.
b) A point P moves inside the square such that;
i) 𝐴𝑃 ≤ 𝑃𝐵
ii) 𝐴𝑛𝑔𝑙𝑒 𝐴𝑃𝐵 ≥ 900
iii) P is nearer to AD than AB. construction on the square in (a) show the region that P must lie by shading.
c) Find the area of the region where P must lie.
Date posted:
May 7, 2019
.
Answers (1)