
Columns and Rows
- A spreadsheet is a grid consisting of columns and rows. Rows are labeled with numbers,
and columns are labeled with letters, giving each cell a unique address consisting of a
number and a letter. If you are familiar with the old game "Battleship", you'll be quite
comfortable with cell addressing.
- A cell may contain labels or values. A label is a text entry, such as TOTAL, that cannot
be manipulated by the spreadsheet. A value can be a number, a date, a formula, or the
answer of a formula.
- A single "grid", or page, is usually referred to as a worksheet.
Formulas
- Formulas are used to express mathematical relationships between cells. For example,
C1=A1+B1 would calculate and display the sum of cells. Al and B1 into cell Cl. It could
also be a simple mathematical formula, such as (100 * 3) / 40. Formulas are not displayed
on spreadsheets. What you see in the cell is the result of the formula.
- Don’t forget about order of operations; anything inside parenthesis happens first,
followed by multiplication and division, followed by addition and subtraction. When in
doubt, use parenthesis to say exactly what you mean.
Functions
Functions are used as shortcuts when performing .mathematical calculations. They are preprogrammed
formulae that give power and flexibility to spreadsheet calculations. They prevent
the user from having to continually enter long and cumbersome expressions. Some examples are
SUM, AVERAGE, MAX, and MIN. Ranges A range is a block of cells. Formulas can act on
single cells or be directed to act on a range of cells. For example, the range A1:D1 includes the
cell Al, Bl, Cl and D1. Any calculation performed in Al will also be performed in Bl, Cl and Dl,
Graphs and charts
- Data in spreadsheets can be displayed in a graphic form. Spreadsheets allow the£
numerical' data in the cells to be displayed as a graph or chart. These graphics, which
illustrate the meaning of the numbers in the spreadsheet in different ways, can be used to
stimulate interest and help make a point.
- There are several different types of graphs that can be made. Area graphs, bar and
column graphs, line graphs, pie charts, scatter plot diagrams and 3-D graphs are some
examples.
Kavungya answered the question on May 14, 2019 at 06:50
-
Identify five types of file extensions.
(Solved)
Identify five types of file extensions.
Date posted:
May 13, 2019
.
Answers (1)
-
The following diagram gives an overview of computer software:
Required:
Identify two examples of each of the following computer software’s:
i. General purpose application programs.
ii. Application specific...
(Solved)
The following diagram gives an overview of computer software:
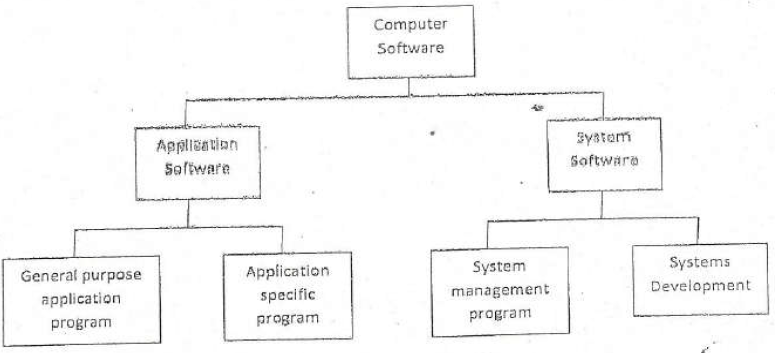
Required:
Identify two examples of each of the following computer software’s:
i. General purpose application programs.
ii. Application specific programs.
iii. System management programs.
iv. Systems development programs.
Date posted:
May 13, 2019
.
Answers (1)
-
(i) Briefly explain the term "machine level programming language".
(ii) State two advantages and three disadvantages of a machine level programming language.
(Solved)
(i) Briefly explain the term "machine level programming language".
(ii) State two advantages and three disadvantages of a machine level programming language.
Date posted:
May 13, 2019
.
Answers (1)
-
Discuss the factors that determine the processing power of a computer.
(Solved)
Discuss the factors that determine the processing power of a computer.
Date posted:
May 13, 2019
.
Answers (1)
-
Describe the following characteristics of computer "memory
i. Mutability
ii. Accessibility
iii. Addressability
iv. Volatility
(Solved)
Describe the following characteristics of computer "memory
i. Mutability
ii. Accessibility
iii. Addressability
iv. Volatility
Date posted:
May 13, 2019
.
Answers (1)
-
Describe four output devices that could be found in a television broadcasting station
(Solved)
Describe four output devices that could be found in a television broadcasting station
Date posted:
May 13, 2019
.
Answers (1)
-
Describe four characteristics of fifth generation computers.
(Solved)
Describe four characteristics of fifth generation computers.
Date posted:
May 13, 2019
.
Answers (1)
-
Briefly describe the concepts of downsizing as used in computer technology.
(Solved)
Briefly describe the concepts of downsizing as used in computer technology.
Date posted:
May 13, 2019
.
Answers (1)
-
Information communication technology (ICT) can be categorized into two broad
(Solved)
Information communication technology (ICT) can be categorized into two broad
products; traditional computer-based technologies and digital data communication
technologies.
Required
i. Using suitable examples highlight six traditional office applications of ICT.
ii. Briefly describe three specialized applications of ICT.
iii. Differentiate between "internal networks" and "external networks" as used in digital data
communication.
Date posted:
May 13, 2019
.
Answers (1)
-
(i) Briefly explain four approaches to computing in an organisation
(ii) Give one advantage and one disadvantage of each of the approaches explained in (b) (i)
above
(Solved)
(i) Briefly explain four approaches to computing in an organisation
(ii) Give one advantage and one disadvantage of each of the approaches explained in (b) (i)
above
Date posted:
May 13, 2019
.
Answers (1)
-
Demonstrate briefly how introduction of information technology could affect the following:
i. Products and services
ii. Production economics.
iii. Buyers.
iv. Suppliers.
v. Substitute products.
vi. Competitors.
(Solved)
Demonstrate briefly how introduction of information technology could affect the following:
i. Products and services
ii. Production economics.
iii. Buyers.
iv. Suppliers.
v. Substitute products.
vi. Competitors.
Date posted:
May 13, 2019
.
Answers (1)
-
Outline five methods of entering data into a computer system
(Solved)
Outline five methods of entering data into a computer system
Date posted:
May 13, 2019
.
Answers (1)