 Get premium membership
 and access questions with answers, video lessons as well as revision papers.
- Explain the significance of tourism to Tanzania(Solved)
Explain the significance of tourism to Tanzania
Date posted: May 27, 2019. Answers (1)
- Supposing you were to carry out a field study on the Rift Valley.
(i) State any two objectives of the study.
(ii) State three importance of studying...(Solved)
Supposing you were to carry out a field study on the Rift Valley.
(i) State any two objectives of the study.
(ii) State three importance of studying faulting through field work.
Date posted: May 27, 2019. Answers (1)
- Students of Kambi were to carry out a field study of a river in an area.
(i) State any three reasons why they needed a route...(Solved)
Students of Kambi were to carry out a field study of a river in an area.
(i) State any three reasons why they needed a route map of the area.
(ii) Give two features that they may have observed and studied.
(iii) State any two problems that they may have observed and studied.
(iv) Mention any two follow up activities that they could have taken.
Date posted: May 27, 2019. Answers (1)
- Define the term drainage basin.(Solved)
Define the term drainage basin.
Date posted: May 27, 2019. Answers (1)
- State the effect of crossing the international dateline from West to East.(Solved)
State the effect of crossing the international dateline from West to East.
Date posted: May 27, 2019. Answers (1)
- Use the map of Africa below to answer the following questions.
(i) Name the highways marked X and Y.
(ii) Name the port marked M.
(iii)...(Solved)
Use the map of Africa below to answer the following questions.
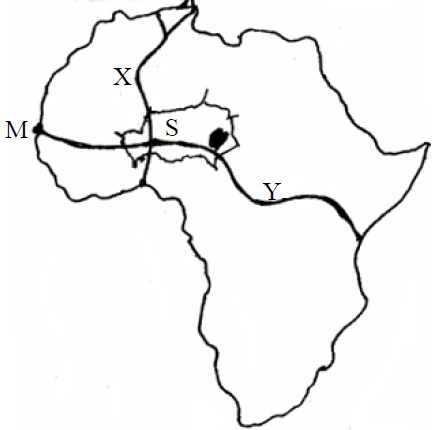
(i) Name the highways marked X and Y.
(ii) Name the port marked M.
(iii) Name the country marked S.
Date posted: May 27, 2019. Answers (1)
- Name four horticulture farms in Kenya.(Solved)
Name four horticulture farms in Kenya.
Date posted: May 27, 2019. Answers (1)
- What is sedentary farming?(Solved)
What is sedentary farming?
Date posted: May 27, 2019. Answers (1)
- Calculate the population density for Kiambu County, given that its area is 2543.4 square kilometers.(Solved)
Calculate the population density for Kiambu County, given that its area is 2543.4 square kilometers.
Date posted: May 27, 2019. Answers (1)
- Six challenges facing industrial sector in Africa(Solved)
Six challenges facing industrial sector in Africa
Date posted: May 26, 2019. Answers (1)
- Describe the Processes in Which Circulation Is Carried Out in a Hydrological Cycle(Solved)
Describe the Processes in Which Circulation Is Carried Out in a Hydrological Cycle.
Date posted: May 4, 2019. Answers (1)
- Give the negative effects of Hydrological cycle(Solved)
Give the negative effects of Hydrological cycle.
Date posted: May 4, 2019. Answers (1)
- State the positive effects of Hydrological Cycle.(Solved)
State the positive effects of Hydrological Cycle.
Date posted: May 4, 2019. Answers (1)
- Describe stream Cut Valleys and their formation.(Solved)
Describe stream Cut Valleys and their formation.
Date posted: May 4, 2019. Answers (1)
- Describe the modes of formation of Gorges.(Solved)
Describe the modes of formation of Gorges.
Date posted: May 4, 2019. Answers (1)
- List the factors favouring formation of braids.(Solved)
List the factors favouring formation of braids.
Date posted: May 4, 2019. Answers (1)
- Explain the effects of Levee Formation.(Solved)
Explain the effects of Levee Formation.
Date posted: May 4, 2019. Answers (1)
- Describe estuaries.(Solved)
Describe estuaries.
Date posted: May 4, 2019. Answers (1)
- Describe the formation of deltas.
(Solved)
Describe the formation of deltas.
Date posted: May 4, 2019. Answers (1)
- Define River Terraces.(Solved)
Define River Terraces.
Date posted: May 4, 2019. Answers (1)