-
A pea plant with smooth seeds was crossed with one with wrinkled seeds. The gene for smooth seeds is dorminant over that for wrinkled seeds....
(Solved)
A pea plant with smooth seeds was crossed with one with wrinkled seeds. The gene for smooth seeds is dorminant over that for wrinkled seeds. Use letter R to represent the dorminant.
(a) State the genotype of the parents if the plant with smooth seeds was heterozygous.
(b) State the gametes produced by the smooth seeds and wrinkled seeds parents.
(c) State the genotype and phenotype of F1 generation. Show your working.
Date posted:
May 27, 2019
.
Answers (1)
-
The diagram below shows a model of the nephron of a mammalian kidney.
(a) Which parts of the nephron are represented by the:
(i) Syringe?
(ii) Perforated rubber...
(Solved)
The diagram below shows a model of the nephron of a mammalian kidney.
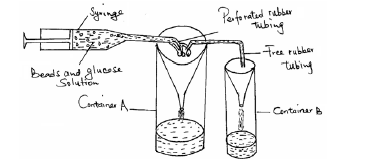
(a) Which parts of the nephron are represented by the:
(i) Syringe?
(ii) Perforated rubber tubing?
(iii) Free rubber tubing?
(b) Name the type of filtration taking place within the perforated rubber tubing.
(c) What would happen to the contents of the syringe if its handle was slowly pushed forward? Explain.
Date posted:
May 27, 2019
.
Answers (1)
-
The picture below shows series of beaks in birds.
a) State the type of evolution that may have led to the emergence of the different beaks...
(Solved)
The picture below shows series of beaks in birds.
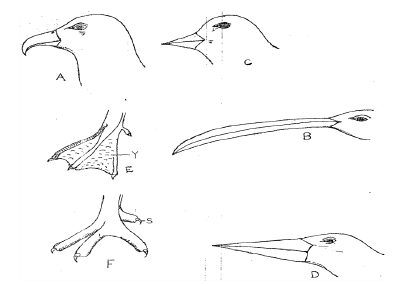
a) State the type of evolution that may have led to the emergence of the different beaks shown on the pictures above.
(b) Name the type of evolution structure represented by the beaks shown on the pictures above.
(c) Observe the pictures carefully. From your observations, what features are responsible for the different types of beaks?
(d) Suggest the type of food likely eaten by birds whose beaks are shown in pictures A, B, C and D.
(e) Briefly state how beak shown in picture A is adapted to feeding.
Date posted:
May 27, 2019
.
Answers (1)
-
In an experiment, lactic acid concentration was measured before, during and after exercise to determine the effect of exercise on the concentration of lactic acid...
(Solved)
In an experiment, lactic acid concentration was measured before, during and after exercise to determine the effect of exercise on the concentration of lactic acid in blood. Study the data obtained and use it to answer the questions that follow.

a) Plot a graph of the concentration of lactic acid against time using a suitable scale. (6 marks)
b) From the graph:
i) Determine the period of exercise.
ii) Explain
c) i) Determine the time when oxygen debt incurred.
ii) Explain
d) i) The duration it took to pay back the oxygen debt
ii) Explain
e) Plot a hypothetical curve for oxygen intake during the experimental period on the same axes.
f) Why does lactic acid level usually continue to rise in the blood after the exercise ceases?
g) State two of effects of lactic acid on tissues.
Date posted:
May 27, 2019
.
Answers (1)
-
The diagram below is a cross section of a portion of alimentary canal.
a) i) Which part of the alimentary canal is represented by the portion...
(Solved)
The diagram below is a cross section of a portion of alimentary canal.

a) i) Which part of the alimentary canal is represented by the portion above.
ii) Give a reason for your answer in (a) (i) above.
b) i) State two functions of the part of alimentary canal represented above.
ii) Explain two structural adaptations of the part of alimentary canal represented above.
Date posted:
May 27, 2019
.
Answers (1)
-
What is the significance of the high tail power in fish locomotion.
(Solved)
What is the significance of the high tail power in fish locomotion.
Date posted:
May 27, 2019
.
Answers (1)
-
The length from tail tip to the anus in a fish is 8cm whereas that from tail tip is 24cm. Calculate the tail power of...
(Solved)
The length from tail tip to the anus in a fish is 8cm whereas that from tail tip is 24cm. Calculate the tail power of the fish.
Date posted:
May 27, 2019
.
Answers (1)
-
The table below shows percentage composition of blood plasma and urine from different substances.
Explain why;
i) There are no plasma proteins in the urine.
ii) Urea...
(Solved)
The table below shows percentage composition of blood plasma and urine from different substances.
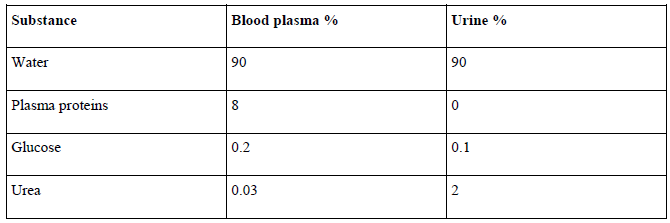
Explain why;
i) There are no plasma proteins in the urine.
ii) Urea concentration is greater in the urine than in the blood plasma.
iii) There is glucose in the urine
Date posted:
May 27, 2019
.
Answers (1)
-
Explain why it is not possible to drown a locust while holding its head under water.
(Solved)
Explain why it is not possible to drown a locust while holding its head under water.
Date posted:
May 27, 2019
.
Answers (1)
-
In an experiment, raw banana was peeled, mashed into a paste and was treated as shown in the set-up below.
a) Name the physiological process being...
(Solved)
In an experiment, raw banana was peeled, mashed into a paste and was treated as shown in the set-up below.
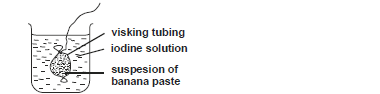
a) Name the physiological process being investigated.
b) State the expected colour of the solutions inside the visking tubing after 30 minutes.
c) Explain the observation made in (b) above.
Date posted:
May 27, 2019
.
Answers (1)
-
Describe one method that can be used to measure the average growth rate of a single leaf.
(Solved)
Describe one method that can be used to measure the average growth rate of a single leaf.
Date posted:
May 27, 2019
.
Answers (1)
-
Why is excretion of nitrogenous wastes more of a problem to animals than plants.
(Solved)
Why is excretion of nitrogenous wastes more of a problem to animals than plants.
Date posted:
May 27, 2019
.
Answers (1)
-
Give two possible ways of establishing the genotype of an organism whose genotype is unknown.
(Solved)
Give two possible ways of establishing the genotype of an organism whose genotype is unknown.
Date posted:
May 27, 2019
.
Answers (1)
-
Two potted plants A and B were placed in the dark for two days. Each was then placed in an air tight bell jar as...
(Solved)
Two potted plants A and B were placed in the dark for two days. Each was then placed in an air tight bell jar as follows then transferred to light for four hours. Each plant was then tested for starch.
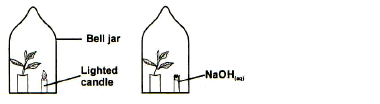
a) why were the plants put in the dark place for two days.
b) what was the result of the starch test in plant B.Expain your answer.
Date posted:
May 27, 2019
.
Answers (1)
-
Name the polysaccharides found in the following structures.
a) Exoskeleton
b) Xylem vessels
(Solved)
Name the polysaccharides found in the following structures.
a) Exoskeleton
b) Xylem vessels
Date posted:
May 27, 2019
.
Answers (1)
-
Name two enzymes and one ion metal that are needed in the blood clotting process.
(Solved)
Name two enzymes and one ion metal that are needed in the blood clotting process.
Date posted:
May 27, 2019
.
Answers (1)
-
A certain animal has no incisor, no canines, 6 premolars and 6 molar in its upper jaw. In the lower jaw there are 6 incisors,...
(Solved)
A certain animal has no incisor, no canines, 6 premolars and 6 molar in its upper jaw. In the lower jaw there are 6 incisors, 2 canines, 6 premolars and 6 molars. Write its dental formula
Date posted:
May 27, 2019
.
Answers (1)
-
Name the organelles that would be most likely found in large numbers in cells that perform the functions below.
a) A cell in the ileum that...
(Solved)
Name the organelles that would be most likely found in large numbers in cells that perform the functions below.
a) A cell in the ileum that actively takes in glucose
b) A cell in the liver that breaks down foreign bodies
Date posted:
May 24, 2019
.
Answers (1)
-
An experiment was carried out to investigate haemolysis of human red blood cells. The red blood cells were placed in different concentration of sodium chloride...
(Solved)
An experiment was carried out to investigate haemolysis of human red blood cells. The red blood cells were placed in different concentration of sodium chloride solution. The percentage of haemolysed cells was determined. The results were as shown in the table below.
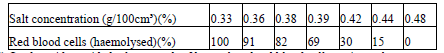
a) i) On the grid provided, plot a graph of haemolysed red blood cells against salt concentration.
ii)At what concentration of salt solution was the proportion of haemolysed cell equal to non-haemolysed cells?
iii) State the percentage of cells haemolysed at salt concentration of 0.45%.
b) Account for the results obtained at:
i) 0.33 percent salt concentration.
ii) 0.48 per cent salt concentration.
c) What would happen to the red blood cells if they were placed in 0.50 percent salt solution?
d) Explain what would happen to onion epidermal cells if they were placed in distilled water.
Date posted:
May 24, 2019
.
Answers (1)
-
The diagram below represents a food web in a certain ecosystem.
a) Name the trophic level occupied by each of the following:
i) Caterpillar .
ii) Small...
(Solved)
The diagram below represents a food web in a certain ecosystem.
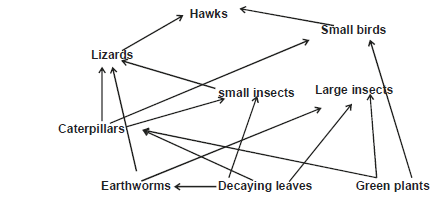
a) Name the trophic level occupied by each of the following:
i) Caterpillar .
ii) Small insects .
b) From the food web, construct two food chains which end with lizards as tertiary consumer.
c) i) Which organisms have the least biomass in this ecosystem?
ii) Explain the answer in c(i) above.
Date posted:
May 24, 2019
.
Answers (1)